USD ($)
$
United States Dollar
Euro Member Countries
India Rupee
د.إ
United Arab Emirates dirham
ر.س
Saudi Arabia Riyal

Exploratory Data Analysis (EDA) Fundamentals for Insight Extraction

Lesson 9/44 | Study Time: 20 Min

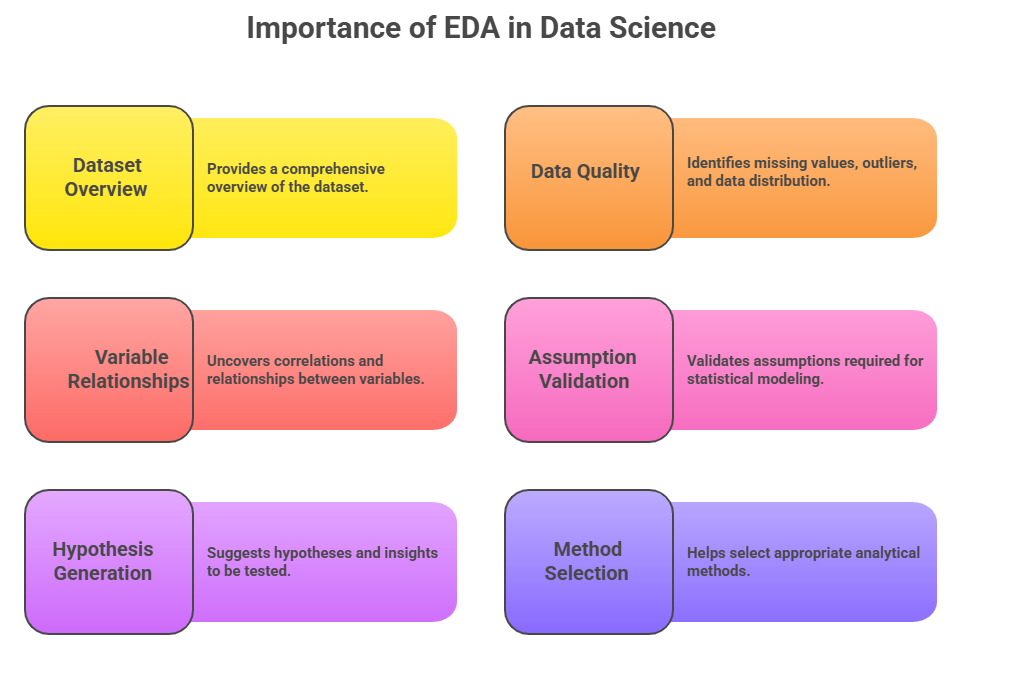
Exploratory Data Analysis (EDA) is a crucial first step in the data analysis process. It involves examining and summarizing data sets to uncover their key characteristics, identify patterns, detect anomalies, and generate hypotheses for deeper analysis.

It helps data scientists understand the underlying structure and relationships within the data, enabling them to make informed choices about subsequent modeling techniques and to ensure that assumptions about data are valid. By visually and statistically exploring data, EDA lays the groundwork for effective and meaningful data-driven decisions.

Steps in Exploratory Data Analysis

Before building models or concluding, it is crucial to explore and evaluate the data thoroughly. The following steps outline a structured path for gaining meaningful insights from raw datasets.


1. Understanding the Data

The first step is to familiarize yourself with the dataset and its context by asking key questions:


What is the source of the data?

What are the variables and their types (numerical, categorical)?

What business or research problem are you addressing?


This understanding guides focused exploration.


2. Data Cleaning and Preparation

Cleaning involves handling missing values, correcting errors, and removing duplicates. Strategies include:


Imputing missing data using mean, median, or more advanced techniques

Identifying and treating outliers

Ensuring consistent data types


Clean data improves the reliability of further analysis.


3. Univariate Analysis

Examining each variable individually to understand distributions and central tendencies, using:


Summary statistics (mean, median, mode, variance, standard deviation)

Visualizations like histograms, box plots, and bar charts


4. Bivariate and Multivariate Analysis

Analyzing relationships between two or more variables:


Scatter plots, correlation matrices, and heatmaps for numerical variables

Cross-tabulations and chi-square tests for categorical variables

Pair plots for multivariate relationships


5. Detecting Anomalies and Patterns

EDA helps spot unusual observations or data entry errors through:


Visual tools such as box plots and scatter plots

Statistical metrics like Z-scores and interquartile ranges


6. Data Transformation

Adjusting data to improve analysis:


Scaling or normalizing variables

Encoding categorical variables

Creating new derived features through mathematical transformations or aggregation

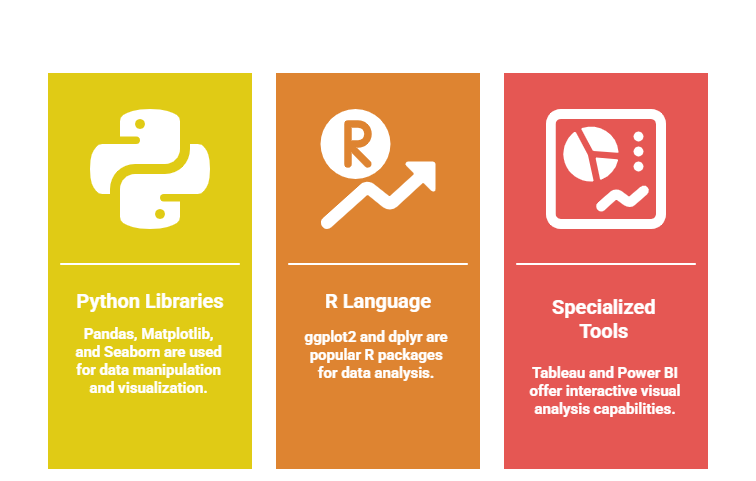
Tools and Techniques for EDA

EDA is supported by software and programming libraries such as:


Chase Miller

Chase Miller

Product Designer
Profile

Class Sessions

1- What is Artificial Intelligence? Types of AI: Narrow, General, Generative 2- Machine Learning vs Deep Learning vs Data Science: Fundamental Differences 3- Key Concepts in Machine Learning: Models, Training, Inference, Overfitting, Generalization 4- Real-World AI Applications Across Industries 5- AI Workflow: Data Collection → Model Building → Deployment Process 6- Types of Data: Structured, Unstructured, Semi-Structured 7- Basics of Data Collection and Storage Methods 8- Ensuring Data Quality, Understanding Data Bias, and Ethical Considerations 9- Exploratory Data Analysis (EDA) Fundamentals for Insight Extraction 10- Data Splitting Strategies: Train, Validation, and Test Sets 11- Handling Missing Values and Outlier Detection/Treatment 12- Encoding Categorical Variables and Scaling Numerical Features 13- Feature Engineering: Selection vs Extraction 14- Dimensionality Reduction Techniques: PCA and t-SNE 15- Basics of Data Augmentation for Tabular, Image, and Text Data 16- Regression Algorithms: Linear Regression, Ridge/Lasso, Decision Trees 17- Classification Algorithms: Logistic Regression, KNN, Random Forest, SVM 18- Model Evaluation Metrics: Accuracy, Precision, Recall, AUC, RMSE 19- Cross-Validation Techniques and Hyperparameter Tuning Methods 20- Clustering Algorithms: K-Means, Hierarchical Clustering, DBSCAN 21- Association Rules and Market Basket Analysis for Pattern Mining 22- Anomaly Detection Fundamentals 23- Applications in Customer Segmentation and Fraud Detection 24- Neural Networks Fundamentals: Architecture and Key Components 25- Activation Functions and Backpropagation Algorithm 26- Overview of Deep Learning Architectures 27- Basics of Computer Vision: CNN Concepts 28- Fundamentals of Natural Language Processing: RNN and LSTM Concepts 29- Transformers Architecture 30- Attention Mechanism: Concept and Importance 31- Large Language Models (LLMs): Functionality and Impact 32- Generative AI Overview: Diffusion Models and Generative Transformers 33- Hyperparameter Tuning Methods: Grid Search, Random Search, Bayesian Approaches 34- Regularization Techniques: Purpose and Usage 35- Handling Imbalanced Datasets Effectively 36- Model Monitoring for Drift Detection and Maintenance 37- Fairness and Mitigation of Bias in AI Models 38- Interpretable Machine Learning Techniques: SHAP and LIME 39- Transparent and Ethical Model Development Workflows 40- Global Ethical Guidelines and AI Governance Trends 41- Introduction to Model Serving and API Development 42- Basics of MLOps: Versioning, Pipelines, and Monitoring 43- Deployment Workflows: Local Machines, Cloud Platforms, Edge Devices 44- Documentation Standards and Reporting for ML Projects

Sales Campaign

Sales Campaign

We have a sales campaign on our promoted courses and products. You can purchase 1 products at a discounted price up to 15% discount.