Exploratory Data Analysis (EDA) using Pandas and NumPy helps beginners understand and summarize datasets through practical inspection, visualization, and basic statistical analysis.
This step builds intuition and prepares data for effective modeling and decision-making.
EDA Using Pandas
Pandas is the primary library for handling structured datasets in data science.
During EDA, Pandas allows analysts to inspect patterns, summarize distributions, identify missing values, filter subsets, and visualize data relationships efficiently.
Its DataFrame structure provides a spreadsheet-like environment where rows represent observations and columns represent features.
This structure supports quick exploration of dataset quality and variability before applying transformations or modeling. Pandas also integrates seamlessly with visualization tools like Matplotlib and Seaborn, making it ideal for early-stage data understanding.
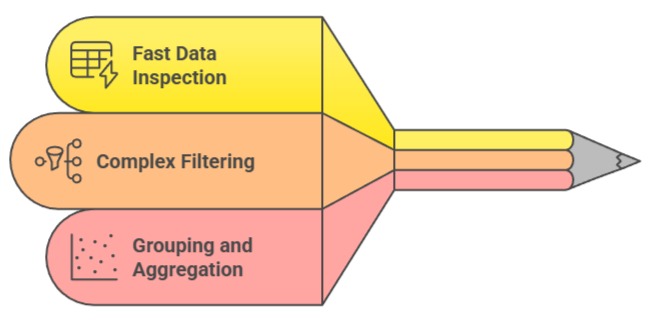
1. Enables Fast and Intuitive Data Inspection
Pandas simplifies the process of loading, viewing, and summarizing datasets using functions like .head(), .info(), and .describe().
These commands instantly highlight column types, missing values, and statistical summaries, helping analysts understand the dataset’s structure within seconds.
Quick inspection reveals inconsistencies such as misplaced values, unexpected data types, or duplicate records.
This speed allows data scientists to iterate rapidly and make adjustments early in the pipeline. Pandas transforms raw tables into accessible insights, creating a strong foundation for deeper analysis.
2. Supports Complex Filtering and Subsetting for Pattern Discovery
Using boolean indexing and query methods, Pandas allows analysts to isolate specific records, groups, or ranges that may reveal hidden trends.
For example, filtering customers based on spending patterns or selecting sensor readings above a threshold uncovers behavioral insights.
These operations enable targeted analysis without altering the original dataset. Such selective slicing is crucial for identifying relationships, validating hypotheses, and preparing segments for modeling.
Pandas makes this process not only efficient but also flexible enough to handle diverse use cases.
3. Facilitates Grouping and Aggregation for Trend Identification
Group-based operations using .groupby() allow analysts to compute summaries across categories, time periods, or user segments.
This reveals higher-level patterns—such as revenue by region or average runtime by machine type—that individual rows cannot show.
Aggregations simplify complex datasets into interpretable summaries, enabling analysts to detect seasonality, anomalies, or imbalances.
Pandas also supports custom aggregation logic, giving full control over the analysis. This feature is essential for identifying factors that influence outcomes in machine learning projects.
Example (Pandas EDA)
import pandas as pd

df = pd.read_csv("sales.csv")

df.head()

df.describe()

df.groupby("region")["revenue"].mean()

df["category"].value_counts()
EDA Using NumPy
NumPy is the foundational library for numerical computation in Python, providing support for multidimensional arrays and fast mathematical operations.
In EDA, NumPy is used for examining raw numerical patterns, computing statistical measures, detecting variability, and performing low-level transformations.
Although Pandas offers high-level functions, NumPy excels when performing direct mathematical analysis on arrays, making it ideal for uncovering numerical patterns that influence model behavior.
Its speed and vectorized operations allow efficient exploration of large datasets.
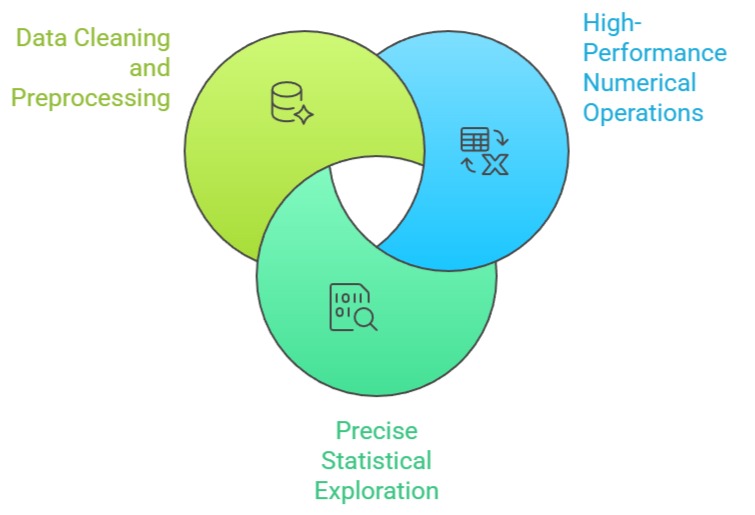
1. Provides High-Performance Numerical Operations for Large Datasets
NumPy can compute statistics, apply transformations, and manipulate entire arrays in a single vectorized step, making operations significantly faster than Python loops.
This speed is valuable during EDA when analysts calculate metrics like variance, standard deviation, or correlations.
NumPy’s efficiency becomes crucial for large-scale scientific data, sensor logs, or real-time streams.
Because numerical exploration is fundamental to understanding feature behavior, NumPy’s processing power enhances the depth and speed of analysis.
2. Offers Precise Control Over Statistical Exploration
NumPy allows direct computation of measures such as percentiles, quantiles, skewness proxies, and covariance matrices.
These help analysts describe how values spread and interact across features. Fine-grained control exposes subtle patterns invisible in basic summaries—for instance, heavy-tailed distributions or tightly clustered intervals.
By allowing custom numerical operations, NumPy helps analysts tailor their EDA to the specific needs of the machine learning problem. This precision leads to more accurate assumptions and stronger model foundations.
3. Supports Data Cleaning and Preprocessing at the Array Level
NumPy arrays simplify tasks like detecting extreme values, replacing invalid entries, scaling data manually, or applying threshold-based rules.
These operations aid in identifying outliers, understanding variability, and preparing arrays for further processing in Scikit-learn.
For datasets requiring mathematical transformation before being converted into Pandas or ML-friendly formats, NumPy provides a foundational preprocessing stage.
This ability ensures that numerical inconsistencies are addressed early, strengthening the downstream analysis pipeline.
Example (NumPy EDA)
import numpy as np

arr = np.array([12, 25, 37, 12, 90, 103, 12])

np.mean(arr)

np.median(arr)

np.percentile(arr, 75)

np.std(arr)
Class Sessions
Sales Campaign

We have a sales campaign on our promoted courses and products. You can purchase 1 products at a discounted price up to 15% discount.