Basic statistics serves as the analytical backbone for interpreting data before applying advanced machine learning techniques.
It helps practitioners understand how values are spread, how stable measurements are, and whether observed patterns arise by chance or represent meaningful trends.
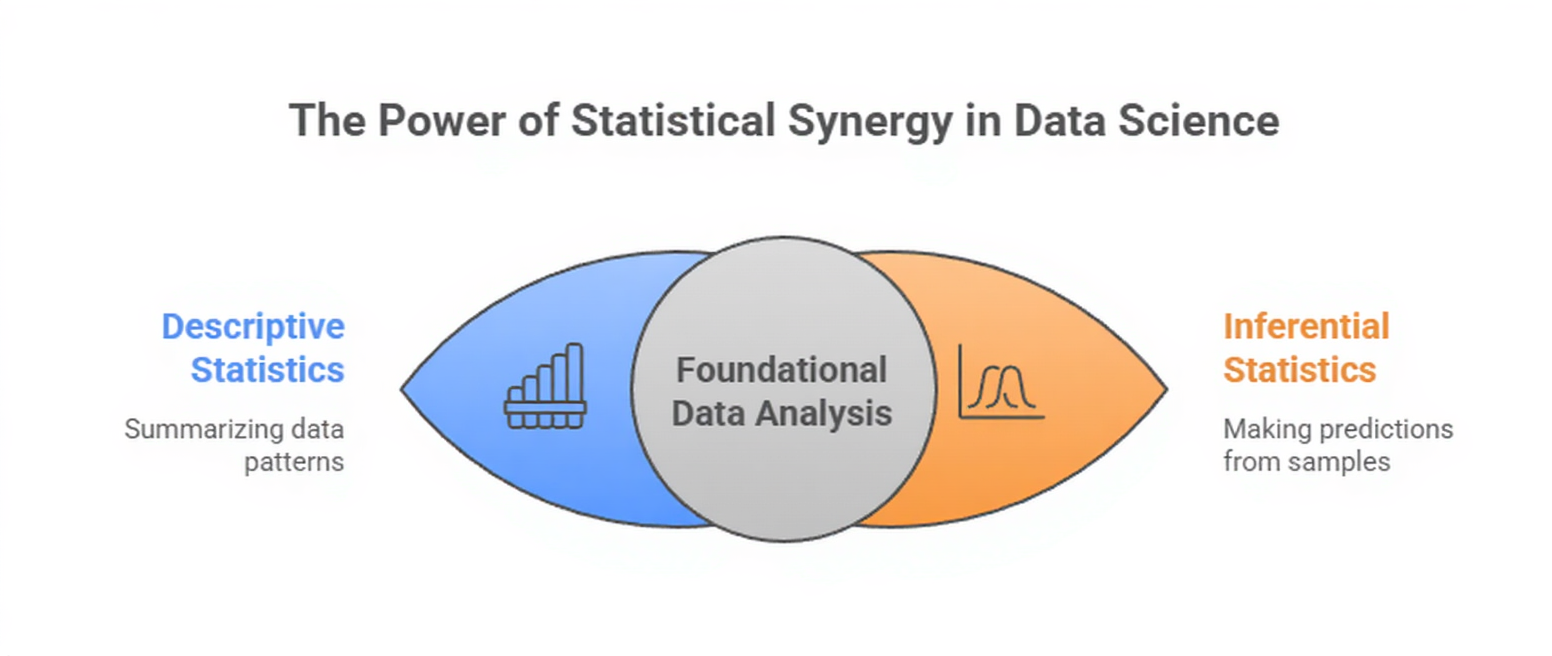
Descriptive statistics summarize and describe key aspects of a dataset such as its central tendency, variability, and shape.
They provide an immediate sense of how data behaves, which is crucial before preprocessing or model selection.
Inferential statistics, on the other hand, focus on making predictions or drawing conclusions about a larger population based on a smaller sample.
Techniques like hypothesis testing, confidence intervals, and significance testing help determine whether patterns are statistically valid or merely random fluctuations.
 Descriptive Statistics
Descriptive statistics deal with summarizing and organizing information so that the structure and behavior of a dataset become immediately visible.
Instead of drawing broader conclusions, they focus only on what is directly observable within the available data.
Using measures such as mean, median, mode, variance, standard deviation, quartiles, and correlations, descriptive statistics reveal the central patterns, spread, and shape of the dataset.
In data science, these summaries act as the first diagnostic layer, helping identify noise, unusual records, imbalances, or relationships among variables.
They are crucial for understanding how features behave before transformation or modeling, ensuring that the learning algorithms receive structured and meaningful inputs.
Examples
1. Mean: Average price of houses in a dataset used for regression.
2. Median: Typical customer spending when outliers distort the mean.
3. Standard deviation: Variability of sensor readings in predictive maintenance.
4. Correlation matrix: Detecting relationships between features before building a model.
5. Distribution plots: Checking skewness in features such as age, income, or transaction amount.
1. Helps Identify Patterns and Data Behavior Quickly
Descriptive statistics reveal the basic structure of any dataset long before modeling begins.
By summarizing how values are distributed, analysts can determine whether the data is tightly clustered, widely spread, or heavily skewed.
These observations guide choices about normalization, scaling, or transformation.
For Example, if a feature shows extreme skewness, algorithms like linear regression may perform poorly unless adjusted.
Recognizing such patterns early prevents inaccurate assumptions during modeling. This makes descriptive analysis an essential first step in the data pipeline.
2. Essential for Detecting Anomalies and Irregularities
Outliers and inconsistent values often distort machine learning models, leading to misleading predictions.
Descriptive metrics like quartiles, ranges, and deviation measures help identify these unusual points.
By examining these summaries, analysts can decide whether to treat, remove, or further investigate anomalies.
Detecting irregularities early ensures models do not learn from faulty signals.
This improves both training stability and predictive accuracy. Descriptive statistics therefore act as a safeguard against hidden data issues.
3. Provides Clarity on Feature Relationships
Correlation and covariance reveal how variables move relative to each other.
Understanding these relationships helps determine which features may contribute positively, negatively, or redundantly to a model. For instance, highly correlated variables may cause multicollinearity, affecting regression models.
Recognizing such patterns helps refine feature selection strategies. This improves model efficiency and interpretability by avoiding unnecessary complexity. As such, descriptive statistics support thoughtful and precise feature engineering.
Inferential Statistics
Inferential statistics focus on drawing conclusions about a larger population based on a sample of data.
Instead of describing what is immediately visible, they help determine whether observed patterns are meaningful, consistent, and generalizable.
Using techniques like hypothesis testing, p-values, confidence intervals, and sampling distributions, inferential methods quantify uncertainty and evaluate whether results occurred by chance.
In machine learning, inferential statistics are essential for validating model performance, testing feature impact, comparing algorithms, and ensuring that insights extend beyond the training data.
They support evidence-based decision-making when deploying models in real-world scenarios.
Examples
1. T-tests: Evaluating whether a new algorithm performs significantly better than a baseline.
2. Confidence intervals: Assessing the expected accuracy range of a classifier.
3. p-values: Determining whether a feature genuinely influences the target variable.
4. Bootstrapping: Estimating the stability of a model across different samples.
5. Sampling techniques: Understanding generalization performance using subsets of data.
1. Enables Evidence-Based Model Validation
Inferential statistics help verify whether improvements in metrics are statistically meaningful. Instead of trusting raw accuracy, analysts use significance tests to check whether performance differences result from genuine model advantages or random noise.
This ensures that chosen models are reliable across different samples. Such validation protects organizations from deploying unstable or misleading models.
By quantifying uncertainty, inferential methods provide a scientific foundation for evaluating ML performance.
2. Helps Determine Whether Patterns Generalize Beyond the Sample
Machine learning models work only if patterns found in training data persist in unseen data. Inferential tools—like confidence intervals and sampling distributions—estimate how stable predictions are likely to be.
These insights aid decisions about dataset size, sampling methods, and model complexity.
They prevent overfitting by showing whether patterns are sample-specific or broadly applicable. Thus, inferential statistics strengthen generalization capabilities and model credibility.
3. Supports Experimental Comparison and Statistical Decision-Making
When comparing models, preprocessing techniques, or feature engineering methods, inferential statistics provide objective criteria for choosing the best option.
Tests like ANOVA or t-tests reveal whether observed differences in performance carry statistical weight. This avoids subjective choices and helps guide experimentation.
With these methods, analysts can make confident, data-backed decisions rather than relying on intuition. Inferential reasoning therefore enhances the scientific quality of ML experimentation.

Class Sessions
Sales Campaign

We have a sales campaign on our promoted courses and products. You can purchase 1 products at a discounted price up to 15% discount.