Performance profiling and analysis are vital practices in software development and system administration to identify bottlenecks, optimize resource utilization, and enhance application responsiveness.
Profiling involves measuring various aspects of a running program or system, such as CPU usage, memory consumption, input/output operations, and latency.
Linux provides an array of powerful tools that facilitate detailed performance profiling and real-time monitoring, enabling developers and admins to make data-driven optimization decisions.
Key Concepts in Performance Profiling
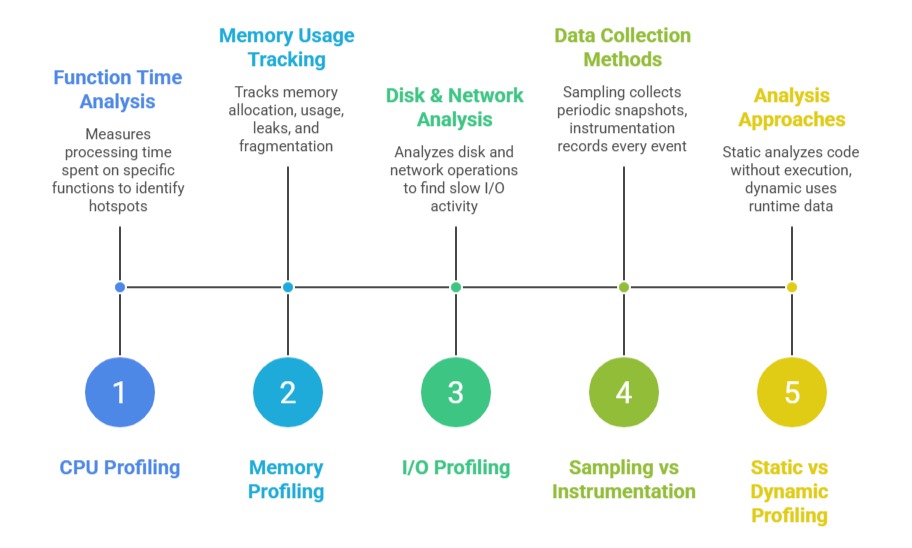
The main elements of performance profiling enable precise identification of performance bottlenecks. The concepts listed below cover different profiling techniques and analysis approaches used in real-world systems.
Popular Performance Profiling Tools in Linux
Linux offers multiple built-in and advanced tools to understand how applications use system resources. The list below introduces the main profiling tools used to monitor performance and detect inefficiencies.
1. perf: An official Linux performance monitoring and profiling tool integrated into the kernel. Features include CPU cycle analysis, cache misses, branch prediction, tracepoints, and dynamic instrumentation.
Commands:
perf record -p <pid>: profile a process.
perf report: view collected data.
perf top: real-time CPU usage by functions.
2. gprof / gprofng: GNU profiler useful for analyzing program call graphs and time spent in functions post-execution with profiling-enabled binaries.
3. Valgrind Massif: A heap profiler focused on memory usage, helping to pinpoint memory leaks or excessive consumption.
4. SystemTap and eBPF: Enable deep, kernel-level tracing and profiling with customizable scripts and low overhead.
5. htop / top / vmstat: Interactive tools for real-time CPU, memory, and process monitoring.
6. strace: Useful for I/O profiling and system call tracing.
Performance Analysis Workflow
Performance analysis is most effective when treated as a continuous, iterative workflow. The steps below show how profiling and monitoring can be integrated into development and deployment pipelines.
1. Define objectives: Identify what metrics (CPU, memory, I/O) are critical for your analysis.
2. Prepare environment: Compile with debug symbols, minimize noise processes.
3. Collect data: Use appropriate tools (e.g., perf record, Valgrind massif).
4. Analyze results: Look for hotspots, bottlenecks, unusual memory patterns.
5. Optimize and iterate: Adjust code, system settings, or configurations, then re-profile.
6. Automate monitoring: Integrate lightweight profiling into continuous integration/deployment pipelines for ongoing assessment.
Example: Using perf for CPU Profiling
perf record -F 99 -p $(pidof myapp) -- sleep 10

perf report
This profiles myapp CPU usage sampled at 99 Hz for 10 seconds, producing a detailed report.