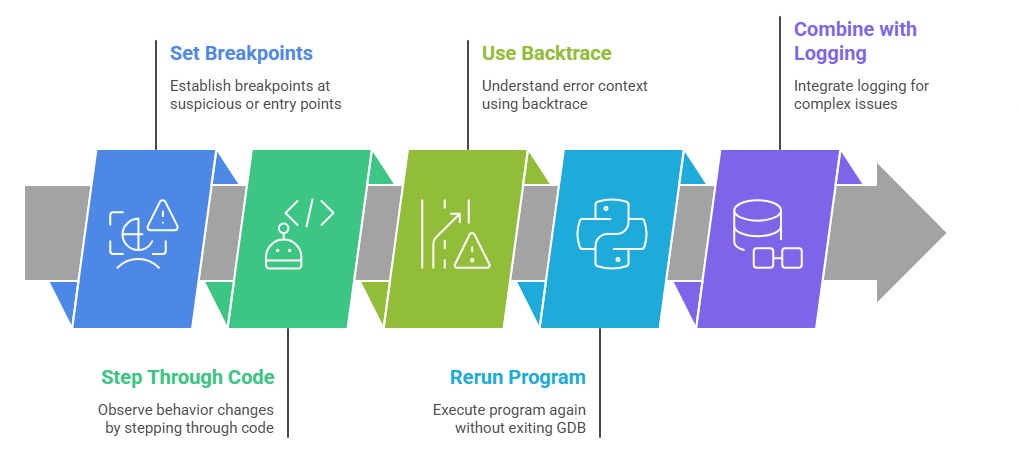
The GNU Debugger (GDB) is a powerful and versatile debugging tool widely used by developers to analyze and troubleshoot programs written in languages such as C and C++.
GDB allows users to observe what happens inside a running program, or examine the state of a program after it crashes.
By enabling features like breakpoints, step execution, variable inspection, and stack trace analysis, GDB helps developers diagnose bugs and understand program behavior in detail.
Preparing Your Program for Debugging
To use GDB effectively, compile your program with debugging symbols included. This is usually done by adding the -g flag during compilation. Debugging symbols provide GDB with information about variable names, lines of code, and structures.
Example:
gcc -g -o myprogram myprogram.cThis command generates an executable with debug info, enabling source-level debugging.
Starting GDB and Basic Commands
Launch GDB with the program:
gdb ./myprogramOnce inside GDB, the prompt (gdb) indicates readiness for commands.
Basic commands include:
run [args]: starts program execution with optional arguments.
break <line/function>: sets breakpoints to pause execution at specified locations.
next (or n): executes the next line, stepping over function calls.
step (or s): steps into functions to debug inside them.
continue (or c): resumes running until the next breakpoint or program end.
print <variable>: displays a variable’s current value.
info locals: lists local variables in the current frame.
backtrace (or bt): shows the call stack, useful for tracing the function call sequence.
quit: exits GDB.
Advanced Debugging Features
1. Conditional Breakpoints: Break only when conditions are met:
break 50 if x > 102. Watchpoints: Pause when a variable changes:
watch variable_name3. Core Dumps: Analyze crashes by loading core dump files.
gdb ./myprogram corefile4. Attach to Running Process: Debug live processes by process id (PID).
gdb -p <PID>Viewing Source Code and Assembly
1. list or l: displays source code around the current execution point.
2. disassemble: shows assembly code for low-level debugging.
3. Graphical frontends or TUI mode (Text User Interface) with:
gdb -tui ./myprogramExamining and Modifying Variables
1. Print variable values with print or p.
2. Change variables during execution:
set var x=423. Inspect memory addresses or complex data structures interactively.

