System call and library tracing are essential debugging and analysis techniques that allow developers to observe the interactions between a program and the operating system or shared libraries it uses.
System calls are the interface by which user-level applications request services from the Linux kernel, while library calls refer to function calls made to shared libraries, such as the C standard library (glibc).
Tools like strace and ltrace provide visibility into these calls, helping diagnose issues, understand program behavior, and optimize performance.
System Call Tracing with strace
strace is the primary tool to trace system calls made by a program. It intercepts and records each system call, its arguments, and return values.
Basic usage:
strace ./myprogramRuns myprogram and outputs system calls as they occur.
- Trace specific calls:
strace -e trace=open,read,write ./myprogramLimits output to the specified system calls.
- Attach to an already running process via PID:
strace -p <pid>- Summary of system call counts and time:
strace -c ./myprogram- Follow child processes created via fork:
strace -f ./myprogramTypical use cases include monitoring file operations, network usage, process creations, and diagnosing permission or resource errors.
Library Call Tracing with ltrace
ltrace intercepts and displays calls to shared libraries made by a program, such as the C standard library functions.
1. Basic usage:
ltrace ./myprogram2. Focus on specific libraries:
ltrace -l libc.so.6 ./myprogram3. Trace child processes similarly with -f.
4. Provides insight on function calls, arguments passed, and return values, useful for higher-level debugging than direct system calls.
Comparing strace and ltrace
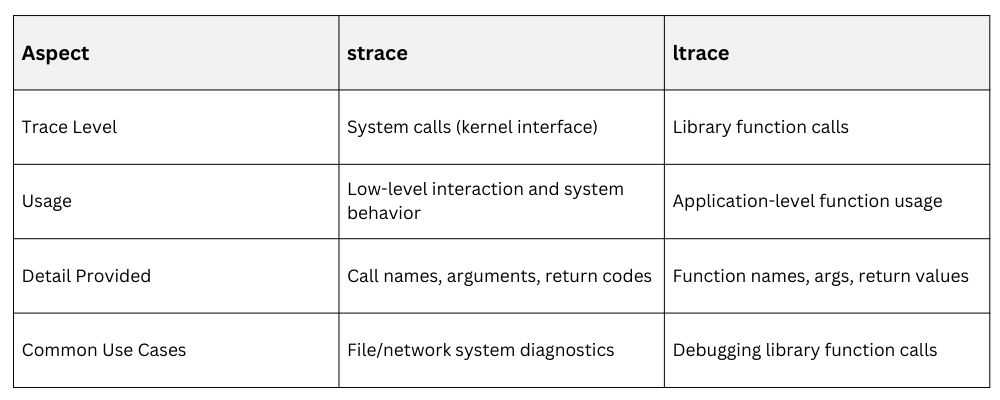
Both tools complement each other for thorough application analysis.
Example: Using strace to diagnose file access
strace -e openat ./myappThis command shows file open calls, helping identify missing files or permission issues.
Example: Using ltrace to observe malloc calls
ltrace -e malloc ./myappTracks memory allocation calls to debug memory usage patterns.
Best Practices
-Picsart-CropImage.png)