Storytelling with data is a powerful technique that combines data analysis, visualization, and narrative to communicate insights effectively and persuasively. Unlike simply presenting raw data or complex tables, storytelling with data transforms numbers into meaningful stories that resonate with the audience, fostering understanding and driving action.
This approach enhances clarity by framing data within context, highlighting key messages, and guiding listeners through a logical, engaging narrative. Whether in business presentations, reports, or dashboards, the art of data storytelling is now recognized as essential for impactful data communication.
What is Storytelling with Data?
At its core, storytelling with data is about translating data points into a coherent narrative that explains what the data means, why it matters, and what behaviors or decisions should follow.
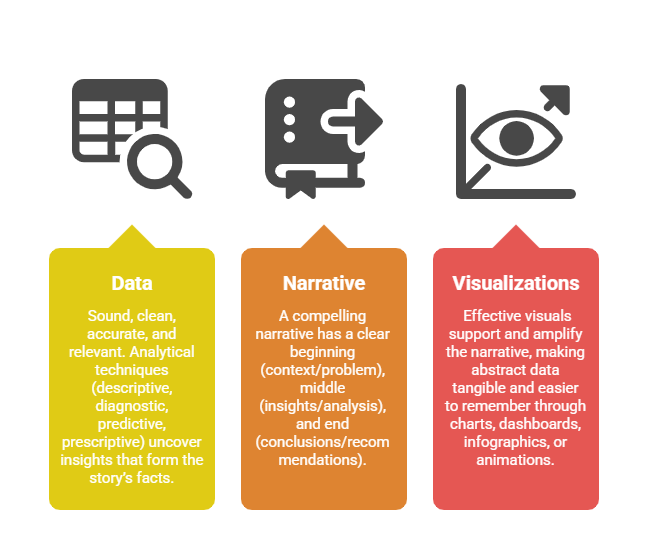
1. Combines data (accurate, reliable analysis), visualizations (clear charts, graphs, visuals), and narrative (context, explanation, and call to action).
2. Goes beyond showing numbers to providing contextual meaning and relevance.
3. Engages audiences by connecting data insights to real-world scenarios or business challenges.
Key Components of Data Storytelling
A strong data story blends facts, context, and visuals into a cohesive message. Here are the central components that contribute to a compelling storytelling framework.
Principles of Effective Data Storytelling
To communicate insights with precision and impact, data storytellers rely on essential best practices. The following principles highlight what contributes to a compelling story.
1. Know your audience: Tailor complexity, language, and visuals to their background and needs. Executives may want summaries; analysts might need detailed data.
2. Start with a clear purpose: Define the question or decision the story aims to influence. Every element should support this goal.
3. Highlight key insights: Focus on critical findings that drive decisions, avoiding information overload.
4. Use narrative structure: Organize content logically with context-setting, conflict/exploration, and resolution/action steps.
5. Make it relatable: Use familiar examples, analogies, or “heroes” (people, teams) to humanize data.
6. Leverage visuals wisely: Choose chart types that naturally fit the data and message; keep visuals simple, clean, and consistent.
7. Maintain accuracy and transparency: Avoid misleading visual tricks and clearly state data sources and limitations.
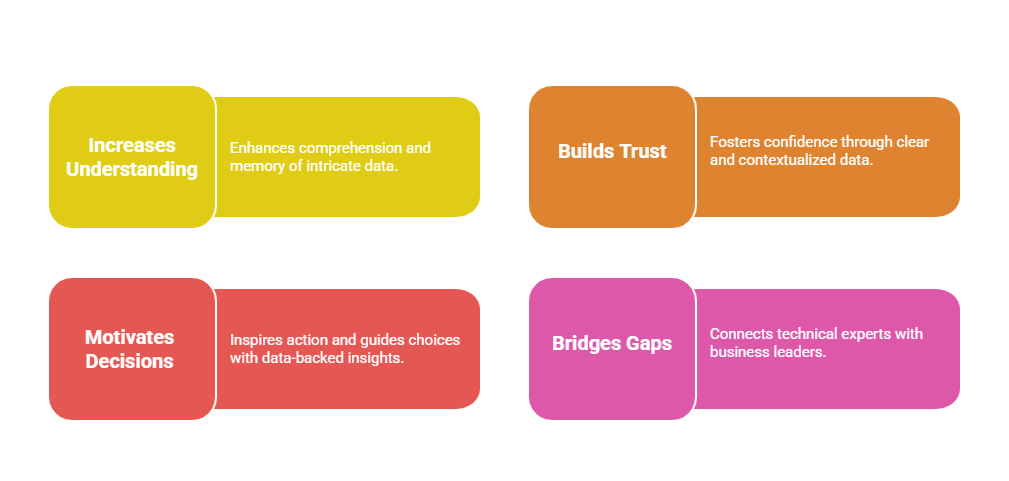
Benefits of Storytelling with Data
When data is framed through narrative, it becomes more memorable, trustworthy, and decision-focused. These are the primary benefits that organizations often experience.
Examples of Data Storytelling in Practice
1. Explaining customer churn causes by combining trend charts with a narrative linking it to product price changes.
2. Presenting sales performance through a dashboard that tells a story of growth, challenges, and future targets.
3. Using visualization and narrative to show the impact of marketing campaigns across regions, driving budget allocations.

Class Sessions
Sales Campaign

We have a sales campaign on our promoted courses and products. You can purchase 1 products at a discounted price up to 15% discount.