Interactive reporting and drill-down techniques are essential capabilities in modern Business Intelligence (BI) that empower users to explore data dynamically and gain deeper insights without generating multiple static reports.
These techniques enable decision-makers to begin with high-level summaries and progressively uncover details through intuitive interactions like clicking or tapping on specific data points.
Interactive reports make data exploration flexible and user-driven, supporting better understanding, faster decision-making, and comprehensive analysis by revealing underlying patterns and root causes within datasets.
What is Interactive Reporting?
Interactive reports provide a user-friendly environment where business users can manipulate data visualizations and reports in real-time.
1. Users can filter, sort, search, and apply dynamic parameters to instantly adjust the data view.
2. Visual components such as charts, tables, and maps respond to user inputs by updating data accordingly.
3. Enables self-service analytics by reducing dependency on IT or data teams for generating new reports.
Examples include dashboard widgets with date-range filters or category selection, and interactive pivot tables.
Drill-Down Techniques
Drill-down refers to the ability to navigate from summary data into progressively detailed layers within the same report or visualization.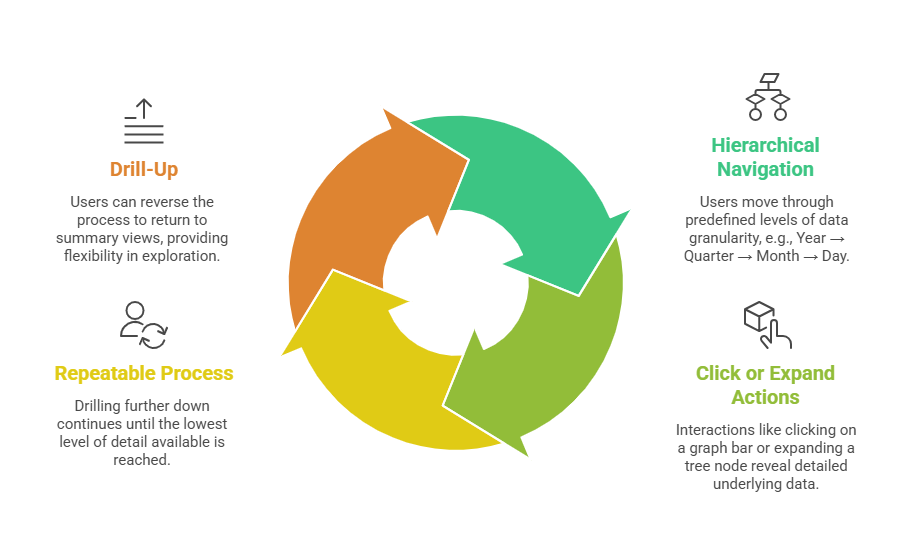
Benefits of Interactive Reporting and Drill-Down
Interactive reporting delivers several strategic advantages that strengthen analytical depth and decision-making. Here are key benefits that organizations typically gain from these capabilities.
1. Enhanced Insights: Allows the uncovering of specific trends, anomalies, or root causes behind aggregate figures.
2. User Empowerment: Business users independently investigate questions and hypotheses without waiting for custom reports.
3. Time Efficiency: Reduces analysis time and streamlines data exploration workflows.
4. Consistent Data Presentation: Maintains a uniform visual context while navigating multiple data levels, improving comprehension.
5. Improved Decision-Making: Supports deeper, evidence-based decisions with immediate access to relevant details.
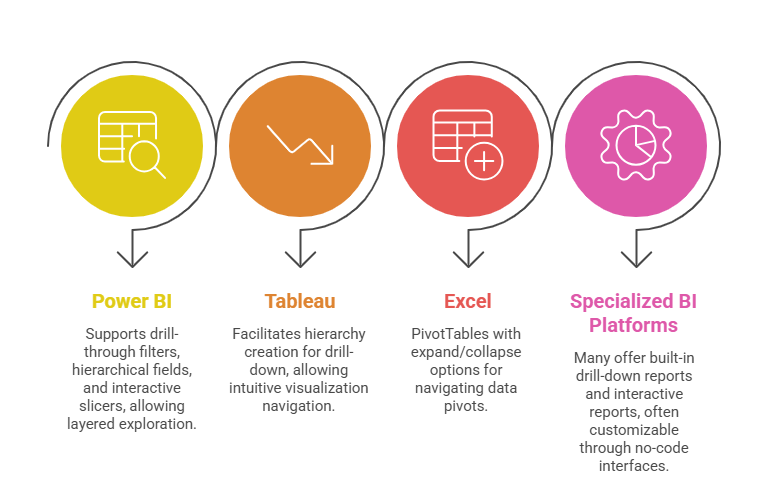
Common Tools and Implementations
Organizations rely on a range of BI platforms to power layered analytics and deeper insights. The following options are frequently used to create drill-down and interactive reports:
Best Practices for Designing Drill-Down and Interactive Reports
For drill-down reports to deliver meaningful insights, the design must support smooth transitions and clear analytics flow. Here are essential practices that contribute to effective and intuitive interactive reporting:
1. Define Clear Data Hierarchies: Plan drill paths logically so users can intuitively move across relevant levels.
2. Maintain Visual Consistency: Use similar chart types and color schemes across levels to minimize disorientation.
3. Provide Contextual Information: Include breadcrumbs, titles, and legends indicating current drill level and filters.
4. Optimize Performance: Ensure data queries behind interactions are efficient to provide near-instant feedback.
5. Educate Users: Offer tooltips, guides, or training to help users understand interactive features and maximize insights.

Class Sessions
Sales Campaign

We have a sales campaign on our promoted courses and products. You can purchase 1 products at a discounted price up to 15% discount.