Monitoring and alerting are essential components of effective Linux system administration, enabling continuous visibility into system health, rapid detection of issues, and timely response to prevent downtime.
Collecting system metrics, analyzing logs, integrating custom monitoring scripts, and configuring alerting mechanisms ensure proactive maintenance and optimized performance. Additionally, identifying trends over time aids capacity planning and troubleshooting.
System Metric Collection
System metric collection involves monitoring key performance indicators such as CPU, memory, disk I/O, network traffic, and process statistics using tools like top, vmstat, iostat, and sar. Advanced monitoring agents, including Prometheus, Netdata, and Zabbix, enable real-time metric collection and export data to centralized monitoring servers.
These metrics can then be aggregated and visualized on dashboards using platforms like Grafana or Kibana, providing insights into system performance and helping identify trends or anomalies.
Custom Monitoring Scripts
Custom monitoring scripts allow administrators to tailor checks for specific applications or operational conditions using shell or Python scripts. These scripts can be scheduled with cron jobs or systemd timers to run at regular intervals.
To integrate effectively with monitoring systems, scripts should return standardized status codes and generate logs in formats compatible with tools like Nagios, ensuring consistent reporting and alerting based on custom criteria.
Example simple disk space check script:
#!/bin/bash

THRESHOLD=80

USAGE=$(df / | tail -1 | awk '{print $5}' | sed 's/%//')

if [ "$USAGE" -gt "$THRESHOLD" ]; then

  echo "Disk usage is above threshold"

  exit 2

else

  echo "Disk usage normal"

  exit 0

fi
Log Aggregation and Analysis
Log aggregation and analysis involve collecting logs from multiple servers using centralized syslog servers such as rsyslog or syslog-ng. Deploying platforms like the ELK stack (Elasticsearch, Logstash, Kibana) or Graylog provides searchable indexes and interactive dashboards, enabling administrators to analyze logs efficiently.
This analysis helps detect security incidents, identify performance bottlenecks, and uncover operational anomalies, supporting proactive system management and troubleshooting.
Alert Configuration
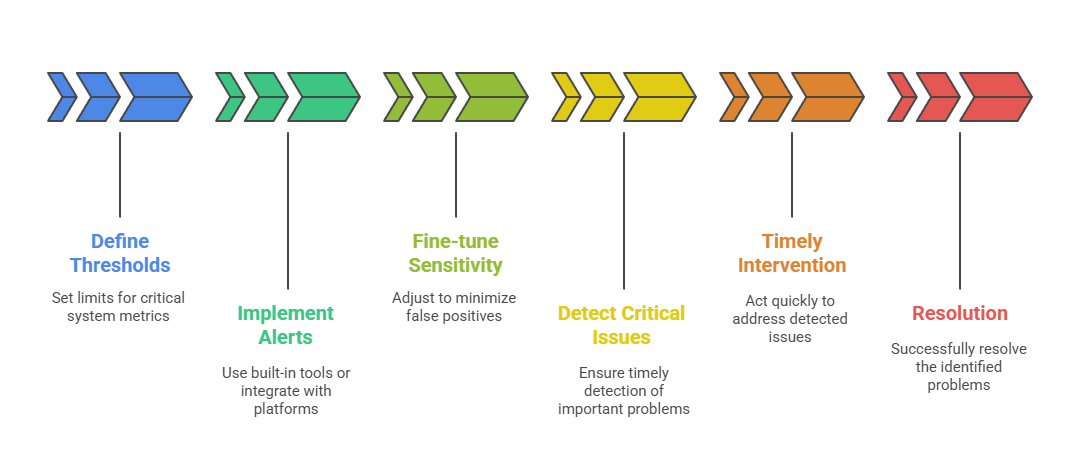 Alert configuration entails defining thresholds on critical system metrics such as CPU load, disk usage, memory utilization, and service availability. Alerts can be implemented using the built-in capabilities of monitoring tools or integrated with external alerting platforms like PagerDuty, OpsGenie, or Slack.
Sensitivity should be fine-tuned to minimize false positives while ensuring that critical issues are detected promptly, allowing for timely intervention and resolution.
Performance Trending
Performance trending focuses on collecting historical system and application data to analyze resource usage patterns and forecast capacity needs. Trend analysis helps identify gradual system degradation, unusual spikes, or seasonal workload variations.
By leveraging this data, administrators can make informed, data-driven decisions for infrastructure scaling, optimization, and long-term capacity planning.