Survival analysis and longitudinal data analysis are two essential statistical approaches in healthcare research, designed to study outcomes that evolve over time.
Survival analysis focuses on the time until an event occurs such as death, disease progression, readmission, device failure, or relapse making it crucial for oncology, chronic disease monitoring, and treatment evaluation.
Unlike traditional statistical methods, survival analysis accounts for censoring, where the full outcome is not observed for all patients due to loss to follow-up or study end.
Techniques like Kaplan–Meier curves, log-rank tests, and Cox proportional hazards models help estimate survival probabilities and compare treatment effects across groups.
Longitudinal data analysis, on the other hand, studies repeated measurements from the same individuals over time. Healthcare frequently generates such data through regular blood tests, vital signs, imaging readings, or quality-of-life assessments.
Longitudinal methods help understand patient progress, disease trajectories, and treatment responses.
They address correlations between repeated measures and missing data issues using tools like mixed-effects models, generalized estimating equations (GEE), and growth curve modeling.
Together, these methods allow researchers to capture both when a clinical event happens and how patient conditions evolve.
They support personalized medicine, early detection of deteriorating conditions, evaluation of intervention effectiveness, and prediction of long-term outcomes.
In modern healthcare, where time-based insights are critical, survival and longitudinal analyses provide scientifically rigorous frameworks for decision-making and precision care.
Methods for Survival and Longitudinal Analysis in Healthcare
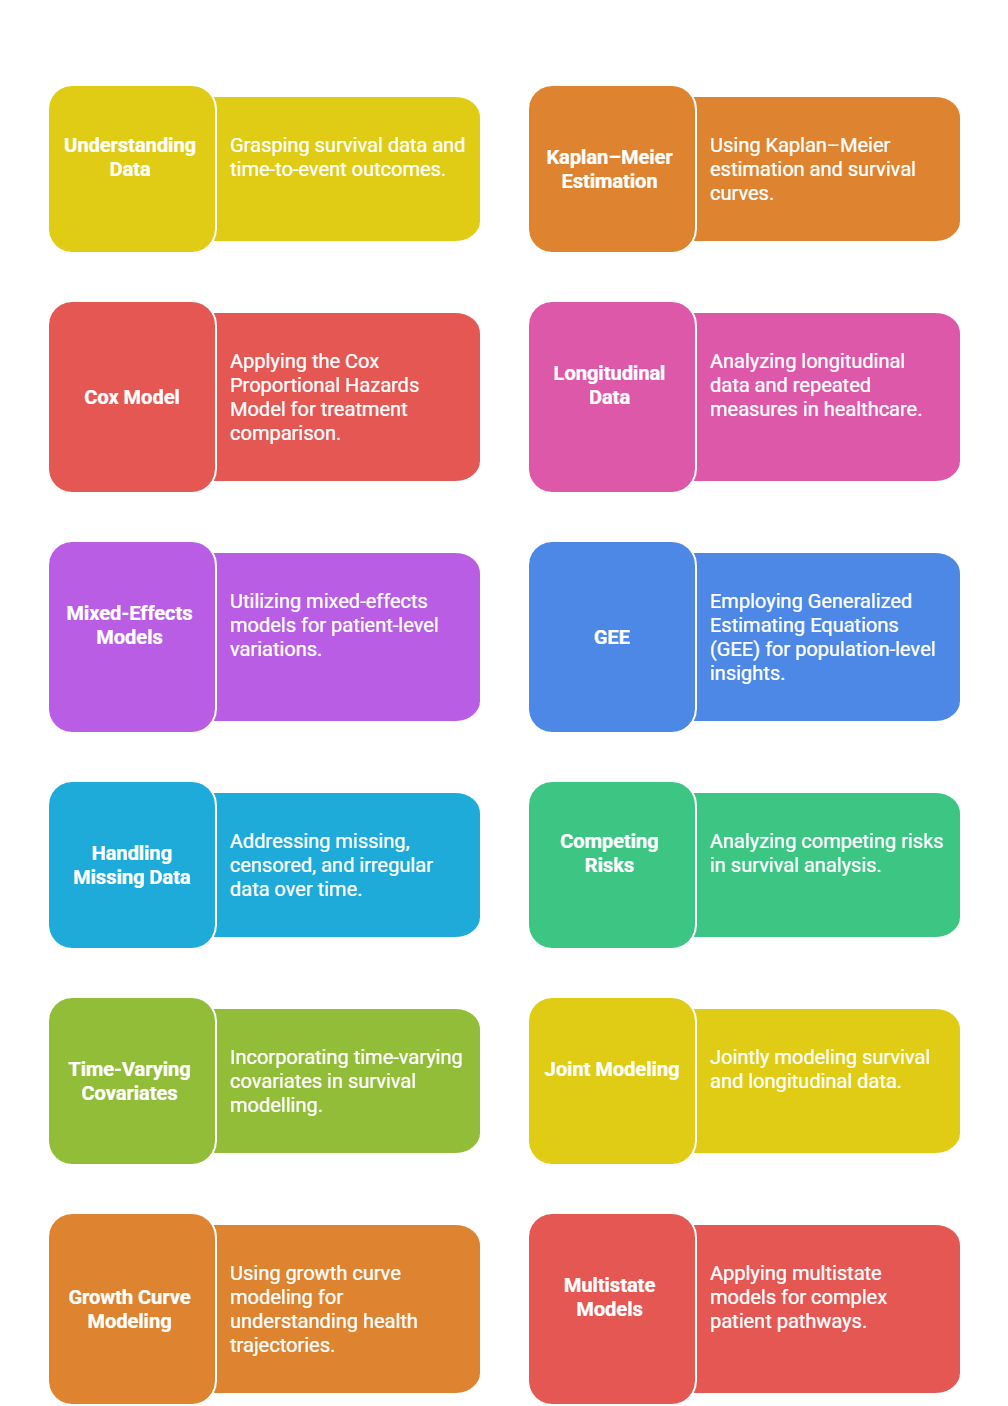
1. Understanding Survival Data and Time-to-Event Outcomes
Survival data focus on the duration between a defined starting point, such as treatment initiation, and the occurrence of a clinical event like relapse or death.
This makes survival analysis highly valuable for studying chronic diseases, cancer therapies, and patient follow-up outcomes.
Time-to-event outcomes offer richer insights than binary results because they capture when an event occurs, not just if it happens.
Analysts must address censoring, variability in observation time, and competing risks.
This complexity ensures survival data reveal true treatment performance under realistic conditions. The method ultimately supports high-quality conclusions in clinical research.
2. Kaplan–Meier Estimation and Survival Curves
The Kaplan–Meier estimator is widely used to compute survival probabilities at different time points. It creates stepwise survival curves that visually represent how patients survive or remain event-free over time.
These curves allow for easy comparison between treatment groups and highlight critical periods of risk or improvement.
Healthcare researchers rely on Kaplan–Meier plots to observe survival trends, identify early treatment effects, and evaluate long-term benefits.
Because it handles censored data effectively, this method provides accurate insights even when full outcomes are not available for all participants. It remains one of the most essential tools in clinical survival analysis.
3. Cox Proportional Hazards Model for Treatment Comparison
The Cox model examines how different variables influence the hazard or risk of an event occurring at any time point. It allows adjustment for patient characteristics like age, comorbidities, genetic factors, or treatment variations.
By estimating hazard ratios, researchers can measure how strongly a factor affects survival probability. The model's semi-parametric nature makes it flexible and robust for medical data.
Healthcare studies extensively use Cox regression for evaluating drug effectiveness, identifying risk predictors, and supporting regulatory approvals. Its ability to control confounders leads to more reliable, clinically meaningful conclusions.
4. Longitudinal Data and Repeated Measures in Healthcare
Longitudinal datasets include observations collected from the same individuals repeatedly across weeks, months, or years.
These datasets capture health progression, therapy effects, and physiological changes more effectively than single-time measurements.
They are essential for chronic disease studies, monitoring patient recovery, and evaluating long-term treatment safety.
Longitudinal data also reveal patient-specific patterns that support personalized care.
However, this data type involves complex correlations between repeated measurements and missing values, requiring advanced statistical techniques. Proper analysis ensures that long-term trends and patient trajectories are accurately understood.
5. Mixed-Effects Models for Patient-Level Variations
Mixed-effects models account for both fixed effects (e.g., treatment, age) and random effects (patient-specific variations).
This makes them ideal for healthcare datasets where individuals respond differently to treatments.
These models help separate overall population trends from unique patient trajectories, enabling precise interpretation of long-term effects.
They handle irregular measurement timings and missing data better than classical statistical approaches.
Mixed-effects models are crucial for evaluating clinical interventions, symptom fluctuations, and personalized treatment outcomes. Their flexibility makes them widely used in longitudinal research, pharmacokinetic studies, and disease progression modeling.
6. Generalized Estimating Equations (GEE) for Population-Level Insights
GEE is a method used to analyze correlated data, especially when the focus is on population-level trends rather than individual-specific predictions.
It estimates the average effect of treatments across all patients while considering correlations within repeated measures. GEE is robust when dealing with non-normal health data such as counts, proportions, or binary outcomes.
It is frequently applied in public health studies, policy evaluations, and hospital interventions.
By capturing overall treatment impact, GEE provides valuable insights for decision-makers and healthcare planners. Its emphasis on marginal effects makes it complementary to mixed-effects models.
7. Handling Missing, Censored, and Irregular Data Over Time
Healthcare datasets often suffer from missing follow-ups, skipped tests, patient dropouts, or irregular measurement schedules.
Survival analysis addresses censored data where the event hasn't occurred yet while longitudinal methods handle missingness through imputation, modeling, or statistical assumptions.
Proper handling of incomplete data ensures unbiased interpretation and avoids overestimating or underestimating treatment effects.
Techniques like last observation carried forward (LOCF), multiple imputation, and likelihood-based methods are commonly used. Effective management of missing data strengthens the reliability of long-term healthcare studies.
8. Competing Risks in Survival Analysis
In many healthcare studies, patients may experience more than one possible event, and the occurrence of one event prevents the occurrence of another.
For example, in cancer research, a patient might die from causes unrelated to cancer before relapse occurs. Traditional survival analysis may overestimate risk if competing events are ignored.
Competing risks models, such as the Fine–Gray subdistribution hazard model, adjust survival estimates to account for these alternative outcomes.
This approach provides a realistic understanding of event probabilities and ensures clinical decisions are based on accurate, unbiased survival estimations. It is especially useful in elderly populations and multi-morbidity scenarios common in modern healthcare.
9. Time-Varying Covariates in Survival Modelling
Many patient characteristics, such as medication dosage, blood pressure, or treatment adherence, change over time and can influence the risk of an event.
Time-varying covariates allow survival models to dynamically adjust to these changes, creating more accurate and clinically meaningful predictions. Cox models can incorporate these evolving variables to reflect real-world patient behavior.
This approach is vital for chronic disease management, where risk profiles continuously shift.
By integrating time-varying data, researchers gain deeper insights into how ongoing treatments affect survival outcomes.
It enhances precision medicine by modeling individual patient pathways more accurately.
10. Joint Modeling of Survival and Longitudinal Data
Joint modeling simultaneously analyzes survival outcomes and longitudinal measurements, linking the two processes statistically.
This is essential when repeated patient measures—such as tumor size or biomarker levels—directly influence survival time. Joint models improve prediction accuracy by treating longitudinal markers as dynamic predictors of event risk.
They also handle missing data more effectively than separate models.
This method is heavily used in oncology, cardiology, HIV studies, and chronic disease progression research. Joint modeling enhances early detection of worsening conditions and supports real-time clinical decision-making.
11. Growth Curve Modeling for Understanding Health Trajectories
Growth curve models analyze how patient outcomes evolve across time, capturing patterns such as improvement, stability, or deterioration.
These models allow researchers to understand the shape of patient trajectories rather than focusing only on isolated measurements.
Growth curve models can detect subtle changes in disease progression that might go unnoticed in traditional analyses.
They also help evaluate treatment effectiveness by showing how patient outcomes shift before, during, and after interventions.
This provides a comprehensive view of long-term health patterns essential for chronic disease management.
12. Multistate Models for Complex Patient Pathways
Many healthcare journeys involve multiple transitions, such as moving from diagnosis to treatment, remission, relapse, and eventually recovery or death.
Multistate models capture these intermediate states and transitions instead of reducing outcomes to a single event. This approach provides rich insights into how diseases evolve and how treatments affect different stages.
Multistate models are particularly valuable in oncology, infectious diseases, and critical care, where patient conditions change rapidly.
They support more detailed risk estimation and better resource planning in hospitals.
They also allow researchers to estimate transition probabilities between health states, improving predictive accuracy.
13. Longitudinal Clustering for Patient Segmentation
Clustering techniques applied to longitudinal data help group patients based on similar health trajectories. This is useful for identifying high-risk groups, personalized treatment strategies, or early warning signs of deteriorating health.
Unlike traditional clustering, longitudinal clustering accounts for time-dependent variations in patient responses.
It helps reveal underlying disease patterns, classify patient pathways, and support precision medicine. Healthcare providers benefit by identifying patients who require intensified monitoring or intervention.
This method enhances targeted care strategies and improves overall clinical outcomes.
14. Visualization Techniques for Time-Based Healthcare Data
Effective visualization is crucial for interpreting survival and longitudinal datasets. Tools such as survival curves, hazard plots, spaghetti plots, and trajectory heatmaps help illustrate patient progress and risk patterns.
These visualizations make complex statistical findings accessible to clinicians, supporting better decision-making.
Time-based visual tools highlight critical trends such as early treatment failures, sudden biomarker changes, or long-term recovery paths.
They also enable quick comparisons between treatment groups. Good visualization enhances communication between statisticians, clinicians, and policymakers.
