Real-World Marketing Data Projects and Case Studies expose learners to practical applications of marketing analytics and data science using real datasets.
They demonstrate how to clean, analyze, and model marketing data to solve problems such as customer targeting, churn prediction, and campaign optimization.
This hands-on approach bridges theory with industry-relevant decision-making and measurable business impact.
Improving Customer Retention & Campaign ROI for an E-Commerce Fashion Brand
1. Project Background
A mid-sized fashion e-commerce brand is experiencing increasing customer acquisition costs (CAC) and declining repeat purchases.
Although website traffic remains steady, engagement and conversions from returning customers are dropping.
The brand suspects that ineffective targeting and irrelevant communication are major causes.
The marketing team decides to run a data-driven project to:
1. Improve retention
2. Reduce churn
3. Increase campaign ROI
4. Personalise marketing communication
5. Identify high-value customer segments
2. Available Marketing Dataset
The dataset contains 1.2 lakh customer records with the following features:
Customer Information
1. Customer ID
2. Age
3. Gender
4. Location
5. First Purchase Date
6. Total Purchases
7. Total Revenue
8. Lifetime Value (LTV)
Behavioral Data
1. Website sessions
2. Pages viewed
3. Add-to-cart actions
4. Wishlist interactions
5. Email opens/clicks
6. Campaign responses
Transactional Data
1. Purchase frequency
2. Time between purchases
3. Average order value (AOV)
4. Returned items
5. Last purchase date
Campaign Data
1. Campaign type (email, SMS, retargeting, push)
2. Offer type (discount, free shipping, new arrivals)
3. Response rate
4. Conversion rate
This dataset allows multiple analyses—segmentation, churn prediction, retention planning, and campaign optimization.
3. Problem Statement
The brand wants to answer three key questions:
1. Which customers are most likely to churn in the next 60 days?
To plan retention campaigns.
2. How can customers be segmented for targeted marketing?
To personalise communication and offers.
3. Which campaign types generate the highest ROI?
To optimise future spending.
4. Step-by-Step Data Analysis Approach
Step 1: Data Cleaning
1. Removing duplicates and invalid customer IDs
2. Handling missing values in demographic and behavioral fields
3. Standardizing purchase dates and formatting
4. Identifying outliers in high spenders
5. Normalizing features for modelling
This ensures dataset readiness for segmentation and ML models.
Step 2: Exploratory Data Analysis (EDA)
Key Findings:
1. 62% of customers purchase only once
2. Repeat customers contribute 78% of total revenue
3. Cart abandonment rate: 43%
4. Discount campaigns perform best among price-sensitive customers
5. Email campaigns outperform SMS in engagement
Visualisations Used:
1. Histograms for purchase frequency
2. Boxplots for revenue distribution
3. Heatmaps for behavioral correlations
4. Line charts for repeat purchase trends
Step 3: Customer Segmentation (Clustering)
Using K-Means Clustering, four clear segments emerged:
Segment A: High-Value Loyal Customers
1. High frequency
2. High AOV
3. Strong engagement
4. Respond well to new launch campaigns
Segment B: Discount Seekers
1. Purchase mainly during offers
2. High cart abandonment
3. Price-sensitive
Segment C: Browsers but Non-Buyers
1. High website activity
2. Low purchase rate
3. Indicate interest but don’t convert
Segment D: Churn Risk Customers
1. No purchases in 90+ days
2. Declining email engagement
3. Low LTV
4. Segmentation helps choose the right message for the right customer.
Step 4: Churn Prediction (Logistic Regression)
Model goal: Identify customers who will not return within 60 days.
Top predictors of churn:
1. Days since last purchase
2. Decrease in email open rate
3. No wishlist or add-to-cart activity
4. Drop in website sessions
5. Low purchase frequency
Model Accuracy: 82%
The model outputs a churn probability score for each customer.
Step 5: Campaign Optimization Analysis
Using campaign-level data:
Insights:
1. "Free Shipping" offers increased conversions by 24%
2. SMS performed poorly except during festival sales
3. Email sequences with product recommendations had the highest ROI
4. Retargeting ads recovered 18% abandoned carts
This analysis helps decide which campaign to use for which segment.
6. Strategic Actions Designed from Insights
1. Retention Campaign Plan
1. For churn-risk customers (Segment D):
2. Personalised email with recently viewed products
3. Limited-time discount to re-engage
4. Loyalty points for next purchase
5. Push notifications with cart reminders
6. SMS only for high-intent customers
7. Expected increase in retention: 12–18%
2. Segmentation-Based Marketing Personalisation
Segment A (High Value):
1. Early access to new launches
2. Exclusive collections
3. Premium loyalty program
Segment B (Discount Seekers):
1. Automated discount coupons
2. Combo offers
3. Sale announcements
Segment C (Browsers):
1. Retargeting ads
2. Product education content
3. Style guides
3. Campaign Budget Optimisation
1. Based on insights:
2. Reduce SMS spending by 30%
3. Increase email automation sequences
4. Allocate higher budget to retargeting ads
5. Test personalised offers by segment
6. Run A/B tests on high-value creatives
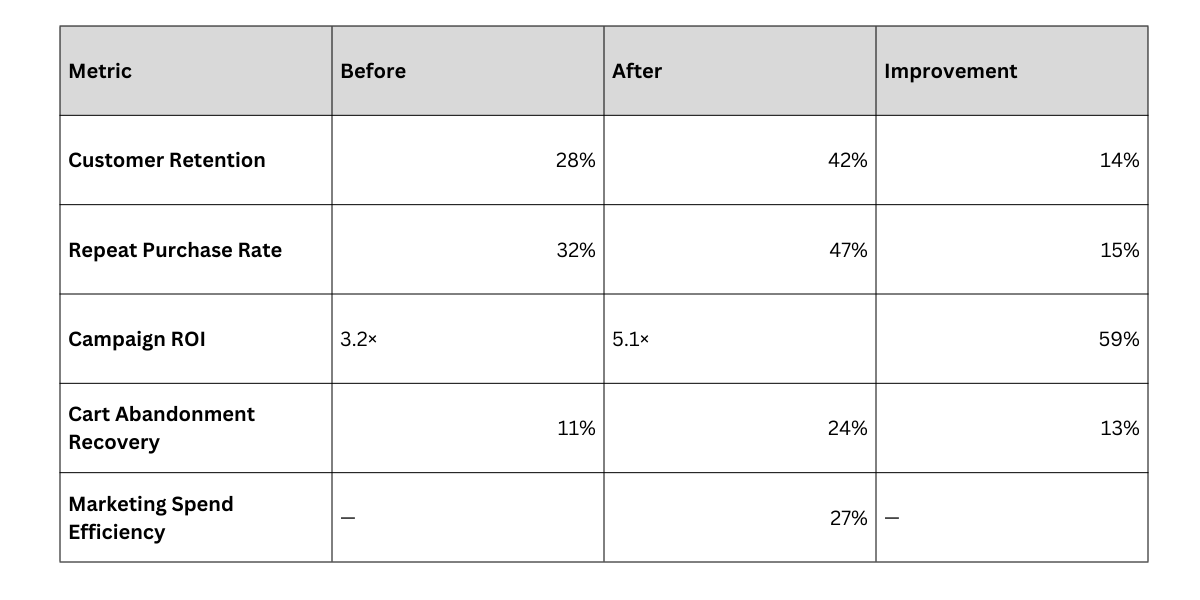
7. Key Measurable Outcomes
After implementing these strategies for 3 months: