Descriptive statistics form the foundation of marketing analytics by helping marketers understand the basic characteristics, patterns, and behaviour displayed in their data.
Before running complex models or visualizing trends, marketers must first summarize datasets using measures such as averages, medians, ranges, percentages, and frequency counts.
These metrics reveal how customers behave, how campaigns perform, and how different segments respond across channels.
Descriptive statistics are essential because marketing data can be large, noisy, and multi-dimensional—collected from digital ads, email campaigns, CRM systems, websites, surveys, and social media interactions.
Initial descriptive analysis provides clarity and helps identify key trends that drive decision-making.
In modern marketing, descriptive statistics support crucial tasks such as calculating conversion rates, segmenting users, evaluating customer lifetime value patterns, and comparing performance across channels.
They also help identify anomalies, such as unusually high bounce rates, outliers in campaign spending, or sudden drops in engagement.
Descriptive analytics has become even more important with the rise of AI-driven marketing, which still requires a strong understanding of baseline behaviours and distributions before applying predictive or machine learning models.
By summarizing data effectively, marketers gain actionable insights that guide budgeting, targeting, content strategy, pricing decisions, and customer experience improvements.
Summarizing and Understanding Marketing Data with Descriptive Statistics
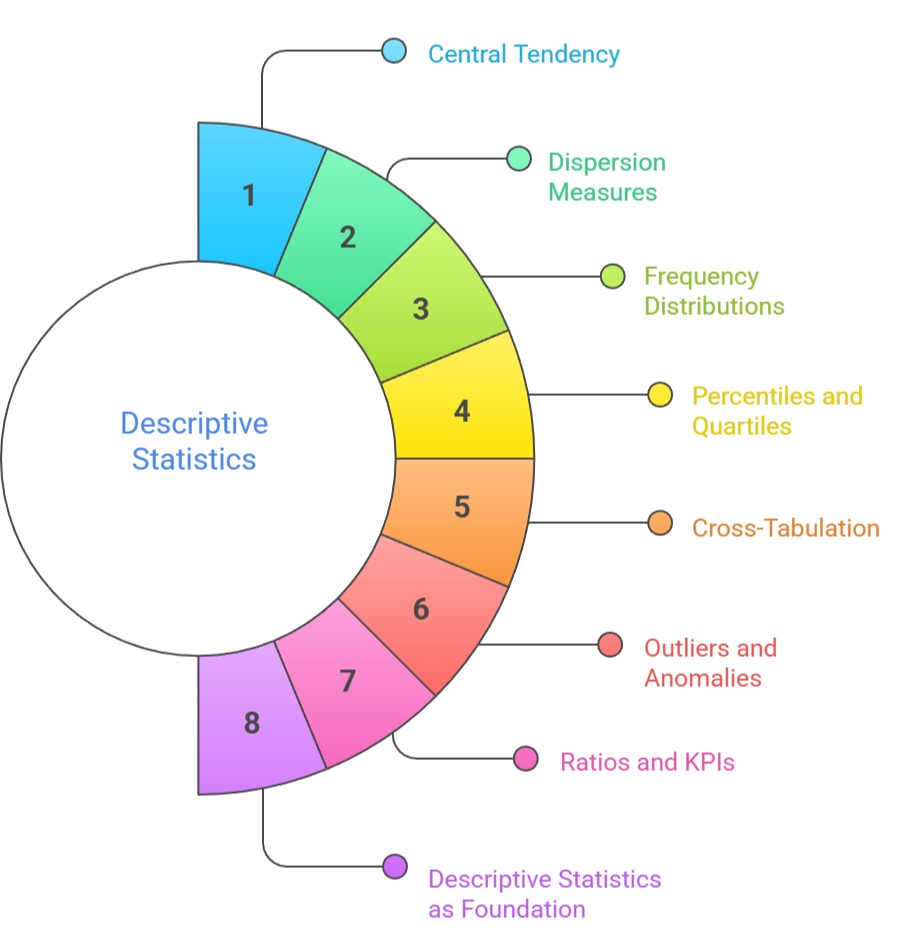
1. Understanding Central Tendency for Marketing Insights
Measures like mean, median, and mode help marketers identify typical customer behaviour and general performance levels.
For example, the average order value (AOV) or average session duration reveals how customers interact with a brand.
The median is useful when marketing data is skewed—like when a few big spenders inflate average revenue.
Mode helps identify the most common customer actions, such as popular products or frequently visited pages.
Central tendency simplifies complex data into understandable summaries that guide campaign expectations and performance benchmarks.
These metrics help teams set realistic targets and identify whether results fall above or below normal behaviour.
2. Using Dispersion Measures to Understand Variability
Dispersion metrics such as range, variance, and standard deviation show how spread out marketing data is.
A campaign with high variance in cost-per-click (CPC) may indicate targeting inconsistencies or unstable audience responses.
Standard deviation helps identify how predictable or unpredictable performance metrics truly are.
If customer purchase amounts vary widely, marketers may need deeper segmentation or personalized offers.
Dispersion also highlights whether averages alone are misleading and encourages analysts to explore patterns more deeply.
Understanding variability helps marketers maintain performance stability and manage risks across channels.
3. Frequency Distributions for Customer Behaviour Analysis
Frequency distributions show how often certain values occur, such as the number of customers who purchased 1, 2, or 5+ times.
They help identify common behaviours, engagement levels, and user flow patterns.
Marketers use frequency tables to analyze email open counts, product purchase categories, website traffic sources, and ad impressions.
This approach provides a structural understanding of how customers move through the funnel.
It also highlights anomalies or unusual spikes that may require investigation.
Frequency patterns guide segmentation, targeting, and personalized journey design.
4. Percentiles and Quartiles for Customer Segmentation
Percentiles and quartiles divide marketing data into segments, helping marketers understand distribution patterns across audiences.
For example, identifying the top 25% of high spenders helps create VIP loyalty strategies.
Quartiles help classify customers by engagement quality, frequency of interactions, or purchase behaviour.
These metrics are especially valuable for building RFM (Recency, Frequency, Monetary) models.
Percentile-based segmentation allows marketers to target campaigns more precisely, optimize budgets, and measure improvements for specific customer groups.
They also help detect inequalities in performance metrics and discover hidden high-value segments.
5. Using Cross-Tabulation for Marketing Comparisons
Cross-tabulation (crosstabs) helps compare two or more variables to detect patterns, such as comparing conversion rates by gender, region, or device type.
It helps marketers understand how demographic and behavioural factors influence customer actions.
Crosstabs reveal relationships that might not be obvious from simple averages—for example, discovering that mobile users convert more under a specific ad format.
This method is widely used in survey analysis, campaign performance reviews, and audience segmentation.
Crosstabs simplify multi-dimensional data into clear, actionable matrices. They support precise targeting and more informed marketing decisions.
6. Identifying Outliers and Anomalies in Marketing Data
Outliers can distort averages and lead to wrong conclusions—for example, a single viral day inflating average traffic.
Descriptive statistics help detect these abnormal values by comparing them to typical ranges or distributions.
Understanding outliers helps marketers determine whether a spike in sales came from a genuine trend or a one-time event, such as a flash sale.
Removing or adjusting outliers ensures cleaner reporting and more accurate forecasts.
Outlier analysis also helps detect fraud, tracking errors, or unexpected user behaviour. It is an essential step before advanced analytics or visualization.
7. Calculating Ratios and Marketing KPIs
Ratios like CTR, CPA, ROI, conversion rate, bounce rate, and customer retention rate are all forms of descriptive statistics.
They summarize performance concisely and allow comparisons across campaigns and time periods.
These KPIs help marketers determine what is working well and what needs improvement.
They are essential for budgeting decisions, A/B testing evaluation, and channel optimization.
Ratio-based insights allow teams to quantify effectiveness and communicate results to stakeholders clearly.
They also form the foundation for dashboards and automated reporting systems.
8. Descriptive Statistics as the Foundation for Visualization
Before creating charts, heatmaps, dashboards, or trend lines, marketers must examine descriptive statistics to understand data behaviour.
Descriptive metrics inform which visualizations will be most effective—for example, using a box plot to show variability or a histogram to display distribution.
They also ensure that visuals are accurate, meaningful, and free of misleading patterns.
Descriptive analysis helps identify which insights should be highlighted visually for stakeholders.
This foundation improves the clarity, impact, and accuracy of visual analytics. It ensures that marketing dashboards reflect true performance trends.
