Excel and Google Sheets are two of the most widely used tools for managing marketing data due to their simplicity, accessibility, and powerful built-in analytical functions.
These tools allow marketers to organize, clean, analyze, and visualize data without requiring advanced programming skills.
From tracking campaign performance to managing customer databases, Excel and Sheets act as flexible and cost-effective platforms for both beginners and experienced marketing analysts.
Because marketing generates large volumes of data—from ads, websites, CRM systems, surveys, and social media—using spreadsheets helps consolidate information in a structured and easy-to-understand format.
Excel provides advanced functionalities such as pivot tables, data validation, conditional formatting, and complex formulas, making it ideal for deep analysis and reporting.
Google Sheets, on the other hand, offers real-time collaboration, cloud accessibility, and integrations with marketing tools like Google Analytics, Google Ads, and Looker Studio.
This makes it especially valuable for teams working remotely or managing continuous data updates.
When used together, both tools help marketers automate routine tasks, compare performance metrics, forecast trends, and prepare clean datasets for further analysis.
Ultimately, Excel and Google Sheets serve as essential foundations in the marketing analytics workflow, allowing teams to turn raw data into meaningful insights efficiently.
Marketing Data Analysis with Excel and Google Sheets
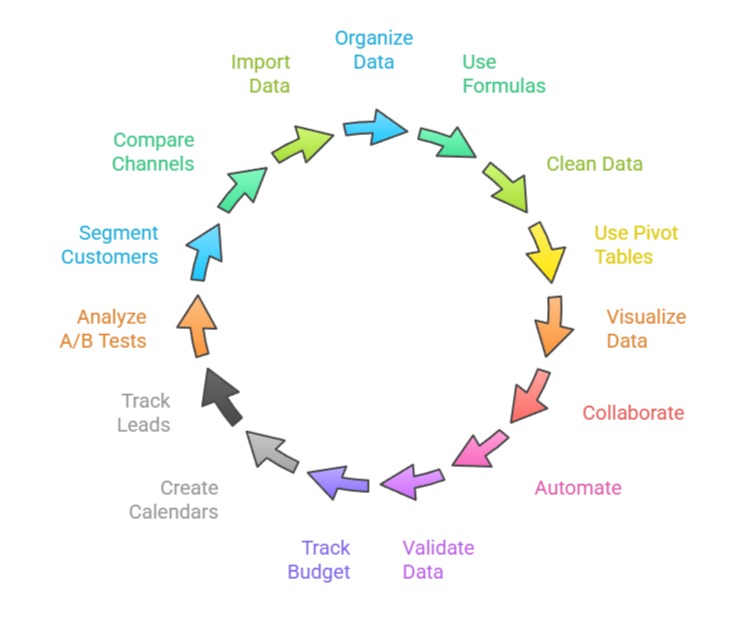
1. Organizing and Structuring Marketing Data
Excel and Google Sheets allow marketers to arrange large datasets in a structured and readable format, making information easier to analyze.
By using tables, headers, and filters, marketers can quickly locate important values such as campaign spend, impressions, or leads.
Proper structuring helps avoid data confusion and prevents misinterpretation of metrics.
Marketing teams commonly use Sheets and Excel to maintain customer lists, sales funnels, and tracking sheets for email campaigns or social media reports.
Features such as freeze panes and custom views improve data navigation. Overall, good organization ensures that datasets remain clean, consistent, and ready for further analysis.
2. Using Formulas for Marketing Calculations
Formulas like SUM, AVERAGE, IF, VLOOKUP, and COUNTIF are essential for analyzing marketing data efficiently.
These formulas help calculate campaign costs, conversion rates, ROI, click-through rates, and other performance metrics instantly.
When marketers automate these calculations, they reduce manual errors and save significant time.
Advanced formulas such as INDEX-MATCH, ARRAYFORMULA (Sheets), and nested IF statements allow deeper analysis of complex datasets.
With the right formula usage, marketers can quickly compare channel performance, generate customer segments, and analyze historical trends.
This capability makes spreadsheets a powerful tool even for medium-scale marketing operations.
3. Cleaning Marketing Data Using Spreadsheet Tools
Excel and Google Sheets offer built-in tools that make data cleaning easier, such as removing duplicates, trimming extra spaces, splitting text into columns, and correcting inconsistent formats.
These tools ensure that marketing datasets stay accurate and error-free before conducting deeper analysis.
Marketers often use cleaning functions to standardize dates, unify campaign names, or correct formatting errors in email or phone number fields.
Since data cleaning is a crucial part of the marketing workflow, spreadsheet cleaning features help save time and improve reliability.
Clean data supports better segmentation, more accurate performance reporting, and reliable forecasting.
4. Using Pivot Tables for Marketing Insights
Pivot tables are one of the most powerful spreadsheet features for summarizing large marketing datasets.
They allow marketers to quickly group, filter, and analyze data such as sales by region, campaign performance by channel, or leads by source.
Pivot tables make it easy to discover hidden patterns without manually calculating totals or creating multiple formulas.
Marketers can drag and drop fields to explore insights dynamically and compare results across different categories or time periods.
This makes pivot tables essential for weekly, monthly, or quarterly reporting. With pivot charts, users can also visualize insights instantly.
5. Visualization with Charts and Dashboards
Excel and Google Sheets offer various chart options—line graphs, bar charts, pie charts, and trend lines—to help marketers visualize campaign performance clearly.
Visual dashboards allow teams to monitor KPIs like traffic, conversions, revenue, and engagement at a glance.
These dashboards can update automatically when new data is entered, enabling real-time performance tracking.
Google Sheets also integrates with Looker Studio, allowing marketing dashboards to become more interactive and automated.
Visualization helps convert raw numbers into meaningful insights that stakeholders can easily understand. Effective charts make reporting faster, clearer, and more impactful.
6. Collaboration and Sharing Features
Google Sheets excels in real-time collaboration, allowing multiple team members to work on the same document simultaneously.
Marketers can add comments, track changes, and manage permissions, making teamwork smoother and more transparent.
Excel also offers collaboration through OneDrive, although Google Sheets is often preferred for cloud-based marketing workflows.
These collaboration tools are useful when teams are tracking campaigns, updating budgets, or analyzing performance together.
Shared documents ensure consistency across teams and help reduce duplicate versions or outdated reports. Collaboration improves communication, efficiency, and overall project alignment.
7. Automation and Integration with Marketing Tools
Both Excel and Google Sheets support automation through add-ons, macros, and integrations.
Google Sheets integrates seamlessly with Google Analytics, Google Ads, and various APIs, allowing automatic data imports and live updates.
Excel supports automation through VBA macros, enabling repetitive tasks like daily report generation or cleaning routines.
Marketers can also connect Sheets to third-party tools like Zapier to automate data collection from forms or CRM platforms.
Automation reduces manual work, eliminates errors, and ensures that marketing teams always work with updated data.
This enhances speed, accuracy, and decision-making quality.
8. Data Validation for Improved Accuracy
Data validation in Excel and Google Sheets ensures that only correct and consistent data is entered into marketing databases.
Marketers can use dropdown lists for campaign names, restrict date formats, or enforce proper email and phone number patterns.
This prevents issues like duplicated campaign labels, misspelled sources, or invalid budget entries.
Data validation greatly reduces the time spent on cleaning errors later and makes reports far more accurate.
It also helps maintain standard naming conventions across teams.
With validation rules in place, marketing teams can avoid inconsistencies that affect segmentation, attribution, and performance analysis.
9. Budget Tracking and Spend Management
Excel and Google Sheets are commonly used to track marketing budgets across channels such as Google Ads, Meta Ads, email campaigns, and influencers.
Marketers can create automated sheets that calculate spend, remaining budget, pacing, and ROI based on real-time inputs.
Conditional formatting can highlight overspending or poor-performing campaigns. Pivot tables can summarize spend by month or channel, helping stakeholders make informed decisions.
This organized system allows teams to stay within budget while maximizing returns. Over time, budget tracking sheets also help forecast future spend more accurately.
10. Creating Marketing Calendars and Content Schedules
Marketers often use spreadsheets to manage content calendars, campaign timelines, and posting schedules.
With color coding, tags, and filters, teams can easily visualize deadlines, content categories, and channel responsibilities.
Google Sheets’ collaboration features allow teams to update progress, add comments, and assign tasks in real time.
These calendars help maintain consistent posting, coordinate cross-channel promotions, and ensure campaigns are launched on schedule.
Teams can also track historical content performance within the same sheet.
This structured planning improves execution and ensures better coordination between marketing, design, and sales teams.
11. Lead Tracking and CRM Pre-Processing
Many teams first collect leads through Google Forms, landing pages, or ad campaigns and initially manage them in Sheets or Excel before importing into CRM systems.
Spreadsheets make it easy to inspect, clean, and categorize leads by source, quality, or stage of the funnel.
Marketers can use formulas to score leads based on engagement or demographics.
Duplicate detection tools help keep lead lists clean and reliable. Additionally, filters and pivot tables allow quick analysis of which channels generate the highest-quality leads.
This preparation ensures that CRM data remains accurate, helping sales teams prioritize effectively.
12. A/B Test Result Analysis
Excel and Google Sheets are ideal for analyzing A/B testing outcomes from emails, webpages, or ad campaigns.
Marketers can input metrics such as clicks, conversions, impressions, or revenue and use formulas to calculate uplift, significance, and winner variation. Charts can help visualize performance differences between variations.
Pivot tables allow deeper segmentation, like analyzing test results by device, region, or customer segment.
This structured analysis helps marketers choose the best-performing creatives and messages.
It also improves the accuracy of future experiments by revealing patterns in customer behavior.
13. Customer Segmentation Using Filters and Functions
Spreadsheets allow marketers to quickly segment customers based on demographics, behavior, purchase history, or engagement levels.
Using filters, conditional formatting, and functions like AND/OR, marketers can identify high-value customers, inactive users, or new subscribers. They can then export these segments for targeted campaigns or ads.
More advanced segmentation using pivot tables and formulas helps identify micro-segments such as “frequent buyers under 30” or “users who engaged but did not purchase.
Spreadsheets give marketers control and flexibility without needing heavy software. This makes segmentation accessible and actionable.
14. Performance Comparison Across Channels
Excel and Google Sheets are often used to consolidate cross-channel data from Facebook Ads, Google Ads, YouTube, SEO reports, and email campaigns.
Marketers can standardize KPIs like CPC, CPA, CTR, ROAS, and revenue to compare performance easily.
Functions and pivot tables help merge datasets and highlight the highest and lowest-performing channels.
Visualizations provide clear insights for leadership and help justify budget redistribution.
By examining data side-by-side, teams can identify trends, optimize campaigns, and eliminate ineffective channels. This comparison is essential for data-driven marketing strategy.
15. Importing and Merging External Data
Marketers often import CSV files from analytics platforms, CRM systems, or ad dashboards into Sheets or Excel.
The tools allow easy merging using VLOOKUP, INDEX-MATCH, or JOIN functions.
This helps create comprehensive reports that bring together traffic data, conversions, customer behavior, and revenue.
Google Sheets’ IMPORT functions (like IMPORTDATA or IMPORTRANGE) allow automatic fetching of data from URLs or other spreadsheets.
Merging external data provides a unified view that improves decision-making across campaigns, customer journeys, and business units. It also reduces time spent switching between platforms.
