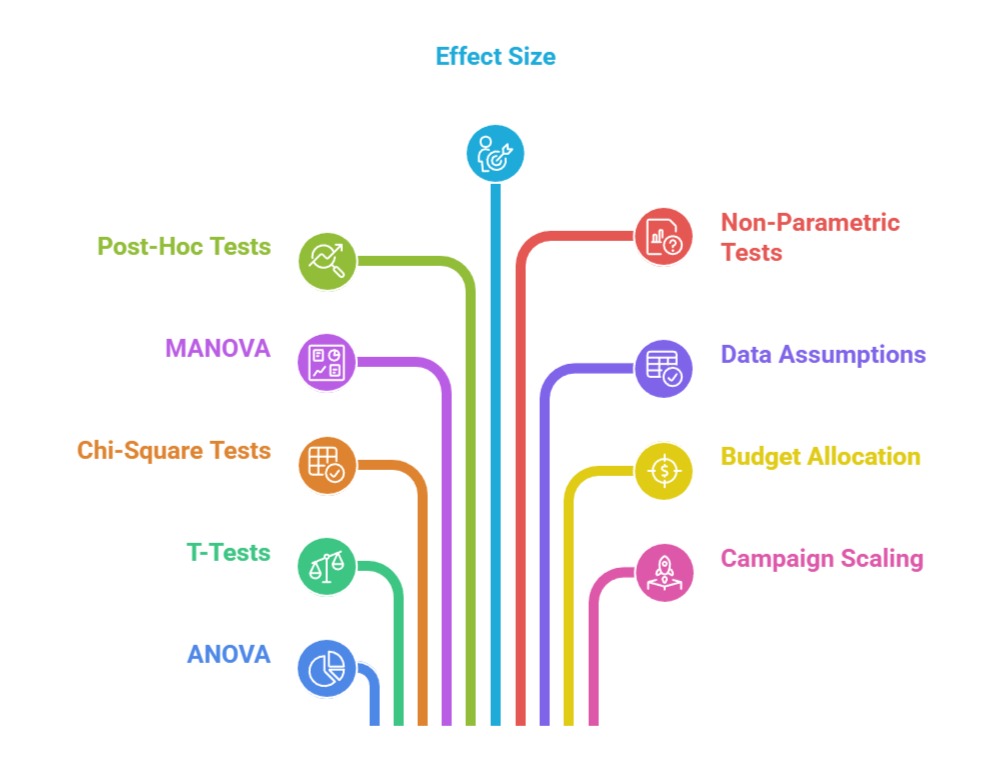
As marketing becomes increasingly data-driven, statistical tests such as ANOVA, chi-square tests, t-tests, MANOVA, and non-parametric methods have become essential tools for evaluating campaign performance.
While A/B testing compares only two variations, modern marketing often requires testing multiple versions of ads, creatives, landing pages, pricing structures, or audience segments at once.
This is where statistical tests—especially ANOVA (Analysis of Variance)—play a crucial role, enabling marketers to compare multiple groups simultaneously and determine whether performance differences are statistically meaningful rather than random.
ANOVA helps identify whether observed variations in key metrics such as click-through rate, conversion rate, dwell time, or revenue per user are caused by actual differences in campaign versions or simply noise.
These tests reduce uncertainty, prevent misinterpretation of results, and ensure decisions are data-backed.
Marketers also use supporting tests like Post-Hoc analyses (Tukey, Bonferroni), chi-square tests for categorical outcomes, and t-tests for two-group comparisons.
Together, these tests enhance the ability to optimize campaigns with greater accuracy and efficiency.
In multi-channel environments—Google Ads, Meta Ads, email marketing, app notifications, website UX—statistical testing enables marketers to evaluate creative effectiveness, customer behavior patterns, and segment-level performance.
This leads to smarter experimentation, better targeting, accurate budget allocation, and continuous improvement.
Ultimately, applying statistical rigor ensures that marketing decisions are not driven by intuition but grounded in measurable, scientific evidence.
Statistical Hypothesis Testing for Marketing Analytics
1. Understanding ANOVA and When to Use It in Marketing
ANOVA (Analysis of Variance) is used when marketers want to compare the performance of three or more campaign variations at the same time.
For Example, testing three homepage designs or multiple ad creatives. Instead of running several t-tests—which increases error—ANOVA evaluates all groups simultaneously and determines whether the mean differences in performance metrics are statistically significant.
This is especially useful in creative optimization, email subject line testing, and multivariate campaigns.
ANOVA provides a cleaner, more reliable comparison across many variations and reduces testing time by allowing simultaneous evaluations.
It helps ensure that decisions are based on true performance differences and not random fluctuations.
2. Applying One-Way and Two-Way ANOVA for Marketing Optimization
One-Way ANOVA is used when testing one factor (e.g., different ad creatives), while Two-Way ANOVA is used when testing combinations of two factors (e.g., ad creative × audience segment).
Two-Way ANOVA is extremely useful for understanding interaction effects—how two variables together influence outcomes.
This allows marketers to uncover deeper insights, such as which creative works best for a particular demographic or device.
These insights help refine segmentation strategies and tailor campaigns for maximum impact. By using ANOVA correctly, marketers can uncover patterns that simple A/B tests could never reveal.
3. Using Post-Hoc Tests to Identify the Best-Performing Campaign Variation
When ANOVA shows significant differences, Post-Hoc tests like Tukey’s HSD or Bonferroni correction help determine which specific variation performed better.
Without Post-Hoc analysis, marketers only know that differences exist—not where they exist.
These tests provide pairwise comparisons that highlight the strongest performing creatives, landing pages, or messages.
This step is crucial in multi-version experiments where choosing the correct variant leads to major performance boosts.
Post-Hoc tests provide detailed insight, helping marketers scale top performers confidently.
4. Using T-Tests for Two-Group Campaign Comparisons
T-tests remain useful when only two campaign variations need comparison—such as comparing a new CTA button against the original.
They determine whether differences in averages (e.g., CTR, conversion rate, session time) are significant. T-tests are easy to apply and widely supported in analytics platforms, making them ideal for quick tests.
They help marketers avoid decisions based on guesswork or small differences that might not be statistically meaningful.
When integrated into A/B testing workflows, t-tests strengthen the validity of results and support evidence-driven optimization.
5. Using Chi-Square Tests for Categorical Marketing Data
Chi-square tests are used when marketers evaluate categorical outcomes—like click vs. no click, purchase vs. no purchase, or add-to-cart vs. abandoned cart.
They help determine whether differences in proportions across variations are significant.
This test is especially useful in email campaigns, ad performance comparisons, and conversion funnels.
Chi-square tests provide insight into behavior distribution rather than averages, helping marketers identify how user choices differ across variations.
This strengthens targeting, segmentation, and conversion optimization efforts.
6. Leveraging MANOVA for Multi-Metric Campaign Evaluation
Modern campaigns often require evaluation across multiple metrics simultaneously, such as engagement, time on site, and conversions.
MANOVA (Multivariate Analysis of Variance) analyzes multiple dependent variables at once, revealing how variations affect several user behaviors together.
This is particularly valuable for UX testing and ad performance studies.
By evaluating multiple outcomes in one model, MANOVA reduces error and provides a more complete picture of variation impact.
It allows marketers to optimize experiences holistically rather than focusing on single metrics.
7. Ensuring Data Assumptions and Test Validity
Statistical tests like ANOVA and t-tests rely on assumptions such as normality, equal variance, and independent observations.
Marketers must verify these conditions through diagnostic checks or use robust alternatives like Welch’s ANOVA or non-parametric tests. Ignoring assumptions can lead to false positives or misleading conclusions.
Ensuring test validity strengthens decision accuracy and builds trust in the experimentation process.
Proper statistical rigor prevents ineffective or harmful campaign changes from being implemented.
8. Using Statistical Tests to Guide Budget Allocation and Scaling
Beyond identifying winners, statistical tests help marketers decide whether a variation’s improvement is large enough to justify full-scale rollout or budget increase.
By quantifying effect size and confidence level, marketers can allocate spending more effectively across channels.
ANOVA is particularly useful in budget optimization for Google Ads and social ads, where multiple creatives compete for budget. Statistical testing ensures that each dollar supports the most efficient variation, maximizing ROI and minimizing wasted spend.
9. Using Effect Size to Measure the Real Impact of Campaign Variations
While statistical significance is important, marketers must also assess effect size to understand whether a difference is practically meaningful.
Effect size measures the magnitude of impact—such as how much a new creative improves conversion rates compared to the old one.
Even if ANOVA or t-tests show significance, a small effect size may not justify scaling or investing additional budget.
This metric helps differentiate between statistically interesting and commercially valuable improvements.
Effect size also guides prioritization, helping marketers choose which campaigns should proceed to full rollout.
By combining significance and magnitude, marketers make more balanced and impactful decisions.
10. Using Non-Parametric Tests When Marketing Data Violates Assumptions
Marketing data often includes skewed distributions, outliers, or non-normal patterns—especially in metrics like revenue, session time, or purchase values.
In such cases, non-parametric tests like Kruskal–Wallis or Mann–Whitney U become essential alternatives to ANOVA and t-tests.
These tests do not assume normality and handle irregular data more robustly, producing more trustworthy results.
They are particularly useful in campaigns with uneven user behavior patterns or low sample sizes.
Using non-parametric methods ensures insights remain accurate even in imperfect data environments. This helps marketers avoid false conclusions caused by assumption violations.
