Query optimization focuses on improving database query performance by reducing execution time and resource usage.
In backend development, inefficient queries can slow down applications and overload databases.
Tools like EXPLAIN plans help developers understand how a database executes a query, showing details such as table scans, index usage, and join methods.
Understanding Query Optimization
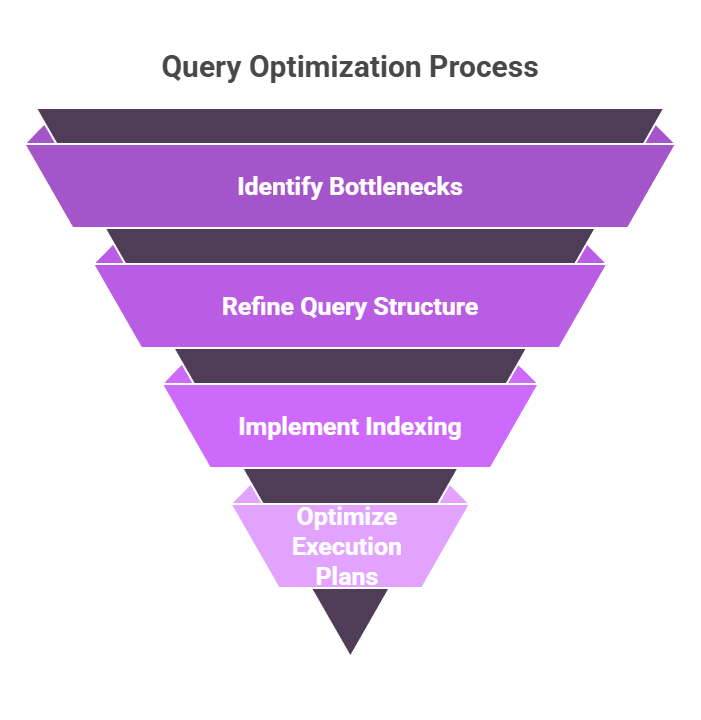
Query optimization isn't about rewriting every SQL statement—it's a systematic approach to making your database work smarter, not harder.
In backend apps, where queries often run thousands of times per minute, even small tweaks yield massive gains.
Backend developers frequently overlook optimization until production hits bottlenecks, but early habits prevent crises. Let's break it down with diagnostics first.
Why Queries Slow Down?
Databases like PostgreSQL or MySQL scan tables sequentially without guidance, leading to full table scans that chew through CPU and I/O. Common culprits include missing indexes, poor join orders, or unfiltered large datasets.
Consider a user-facing e-commerce API querying orders: without optimization, it might scan millions of rows per request.
Factors Slowing Queries
1. Large datasets without filters
2. Complex JOINs on unindexed columns
3. Sorting or grouping massive result sets
4. Locking contention in high-traffic apps
Real-World Fix: A Django app I audited cut query time 90% by indexing a created_at filter—simple, but game-changing.
Demystifying EXPLAIN Plans
EXPLAIN plans are your database's execution blueprint, revealing exactly how a query runs without executing it fully.
Run EXPLAIN before your query to visualize the optimizer's strategy, spotting inefficiencies like costly scans.
This tool is essential for backend devs debugging via tools like pgAdmin or Jupyter-integrated SQL clients. It outputs a tree of operations, with metrics like cost estimates and row counts.
Reading an EXPLAIN Plan Step-by-Step
Follow this numbered process to interpret plans:
1. Prefix with EXPLAIN (ANALYZE): Use EXPLAIN ANALYZE for real timings (careful in production—it runs the query).
2. Scan top-down: Start at the root node (e.g., "Seq Scan") to see the main operation.
3. Check costs: "Startup Cost" and "Total Cost" are relative units; higher means slower.
4. Rows estimate: Predicted vs. actual rows highlight optimizer guesses.
5. Loops and buffers: In ANALYZE output, these show real runtime and cache hits.
Example Query and Plain EXPLAIN Output
EXPLAIN (ANALYZE, BUFFERS)

SELECT * FROM orders WHERE customer_id = 123 AND status = 'shipped' ORDER BY created_at DESC;Seq Scan on orders (cost=0.00..1.25 rows=1 width=64) (actual time=0.015..0.016 rows=1 loops=1)
Filter: ((customer_id = 123) AND (status = 'shipped'))
Rows Removed by Filter: 999
Buffers: shared hit=4
Planning Time: 0.072 ms
Execution Time: 0.028 msHere, Seq Scan flags a full table scan—bad for large tables. "Rows Removed by Filter: 999" means it checked 1000 rows to find
Interpreting Common Nodes
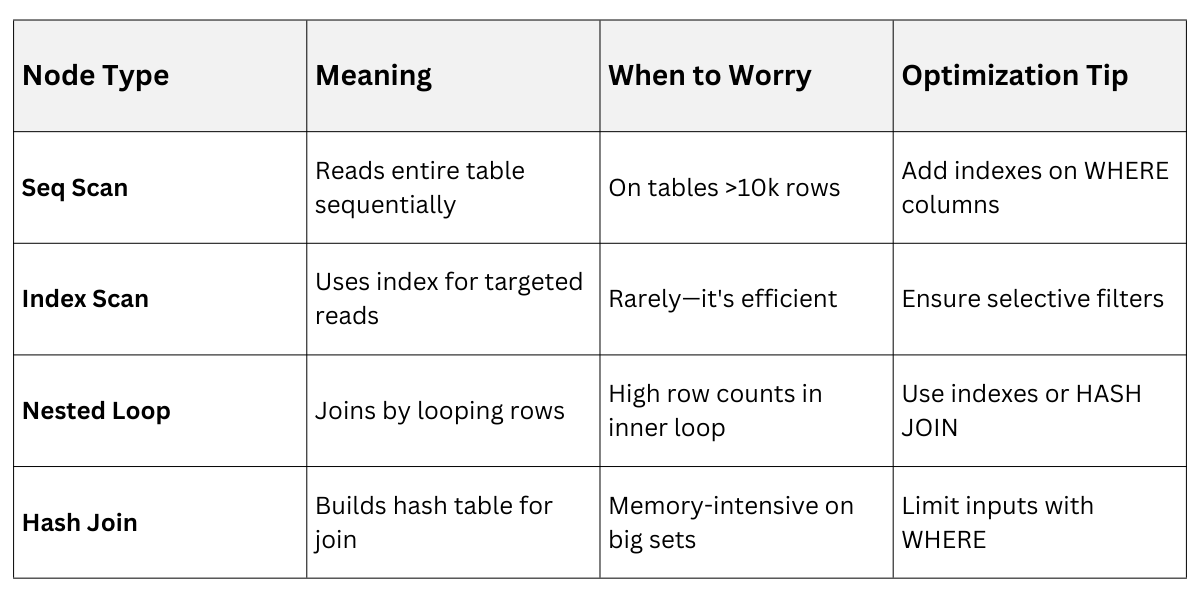 Pro Tip: In Python backends, integrate via django.db.connection.explain() or SQLAlchemy's echo=True for logging.
Simple Indexing Strategies
Indexes are like a book's index—speedy lookups without reading every page. A B-tree index (default in PostgreSQL/MySQL) sorts data for fast range scans and equality checks, but adds write overhead.
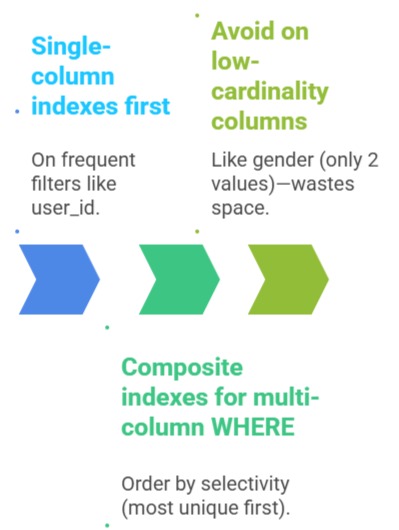
Start simple: Index columns in WHERE, JOIN, ORDER BY, or GROUP BY clauses. Over-indexing bloats storage, so target high-read, selective columns.
Core Indexing Rules
Creating and Maintaining Indexes
1. Analyze query patterns: Use EXPLAIN on slow queries from app logs.
2. CREATE INDEX: CREATE INDEX idx_orders_customer ON orders (customer_id);
3. Composite: CREATE INDEX idx_orders_cust_status_time ON orders (customer_id, status, created_at);
4. Monitor with pg_stat_user_indexes: Check index usage.
5. Reindex periodically: REINDEX TABLE orders; for bloated indexes.
Python Integration Example (Django migration)
# In a migration file

from django.db import migrations


class Migration(migrations.Migration):

    operations = [

        migrations.RunSQL("CREATE INDEX CONCURRENTLY idx_orders_customer ON orders (customer_id);"),

    ]
Best Practice: Use CONCURRENTLY to avoid locking production tables.
Beyond Basics: Partial and Expression Indexes
For advanced tweaks:
1. Partial indexes: CREATE INDEX idx_active_orders ON orders (customer_id) WHERE status = 'active';—smaller, faster for common filters.
2. Expression indexes: CREATE INDEX idx_lower_email ON users (LOWER(email)); for case-insensitive searches.
Query Rewrite
-- Slow: Func on column

SELECT * FROM users WHERE LOWER(email) = 'user@example.com';


-- Fast: Uses index

SELECT * FROM users WHERE email ILIKE 'user@example.com';  -- Or indexed func