Statistical methods are the foundation of Business Intelligence (BI), transforming raw data into actionable insights by revealing patterns, relationships, and trends. These methods enable organizations to make data-driven decisions, optimize operations, predict future outcomes, and assess risks with confidence.
By applying descriptive, inferential, and predictive statistics, BI practitioners convert data into meaningful knowledge that supports strategic and operational goals.
Descriptive Statistics: Summarizing Data
Descriptive statistics provide an initial understanding of data sets by summarizing main features and distributions without making predictions or inferences.
1. Measures of Central Tendency: Mean, median, and mode describe typical values in data.
2. Measures of Dispersion: Range, variance, and standard deviation quantify data spread and variability.
3. Frequency Distributions: Show the count or percentage of observations across categories.
4. Data Visualization: Histograms, box plots, and summary tables help communicate descriptive metrics effectively.
In BI, descriptive statistics underpin dashboards and reports by presenting key performance indicators (KPIs), sales trends, customer demographics, and other business metrics.
Inferential Statistics: Drawing Conclusions
Inferential statistics extend beyond observed data to make generalizations about a larger population, often using sample data.
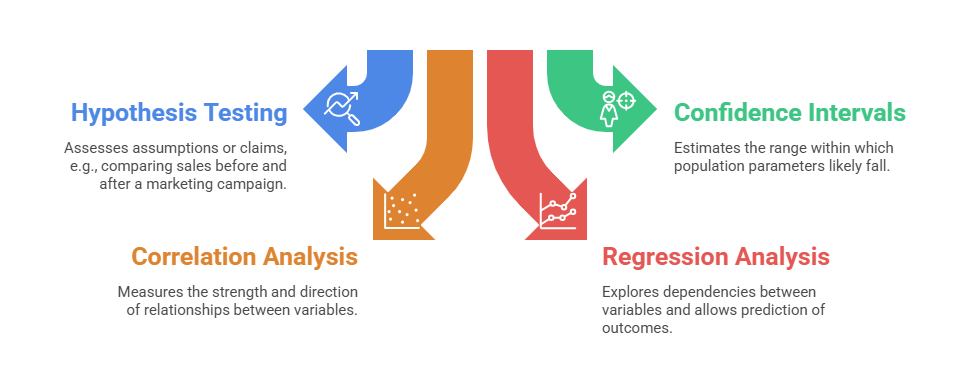
Inferential techniques enable BI users to test business theories, evaluate changes, and quantify uncertainty in decision-making.
Predictive Analytics: Anticipating the Future
Predictive analytics employs statistical and machine learning methods to forecast future events based on historical patterns.
1. Time Series Analysis: Analyzes data points over time to identify trends, seasonal effects, and cyclical behavior for forecasting demand, revenue, or risks.
2. Classification and Clustering: Segment customers, detect anomalies, or categorize products using algorithms guided by statistical principles.
3. A/B Testing: Statistically tests variations of marketing or product features to determine superior options through controlled experiments.
In BI, predictive analytics supports sales forecasting, customer churn prediction, inventory optimization, and fraud detection, driving proactive strategies.
Statistical Software and Tools in BI
Modern BI ecosystems integrate statistical methods through tools like:
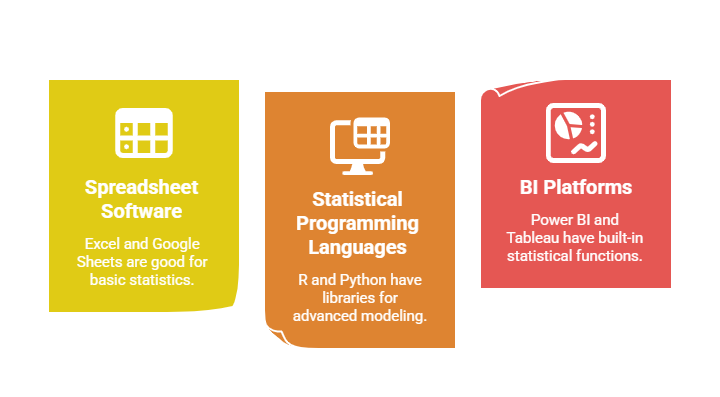
Choosing appropriate tools depends on use case complexity, user skills, and integration needs.
Challenges and Considerations
1. Data Quality: Garbage-in, garbage-out principle requires accurate, clean data for reliable results.
2. Ethical Use: Statistical analysis must respect privacy and avoid biases in model training and interpretation.
3. Interpretability: Results should be presented in understandable terms to enable confident decision-making.
4. Continuous Learning: With evolving data, ongoing validation and recalibration of models are essential.

Class Sessions
Sales Campaign

We have a sales campaign on our promoted courses and products. You can purchase 1 products at a discounted price up to 15% discount.