Visualization tools are essential in modern Business Intelligence (BI) and data analytics, enabling users to transform raw data into interactive charts, dashboards, and reports.
Among the numerous options available, Power BI, Tableau, and Google Data Studio stand out due to their rich features, user-friendly designs, and broad adoption across industries. Understanding their capabilities, differences, and use cases helps organizations and individuals select the right tool for their data visualization and storytelling needs.
Power BI
Power BI is Microsoft’s comprehensive BI platform that integrates seamlessly with other Microsoft products and services, making it a popular choice for enterprises using Microsoft ecosystems.
Key Features:
1. Drag-and-drop report building with an extensive library of visualizations.
2. Robust data connectivity options, supporting databases, Excel, cloud services, and APIs.
3. Advanced analytics through integration with AI services and custom visual development.
4. Real-time dashboard updates, collaboration via Microsoft Teams, and SharePoint integration.
5. Extensive sharing and publishing options with Power BI Service and apps.
Ideal For: Organizations invested in Microsoft Azure and Office 365, businesses requiring enterprise-grade security, and users needing scalable analytics with advanced data modeling via Power Query and DAX formulas.
Pricing: Offers a free desktop version; Power BI Pro for collaboration features; Power BI Premium for large-scale deployments.
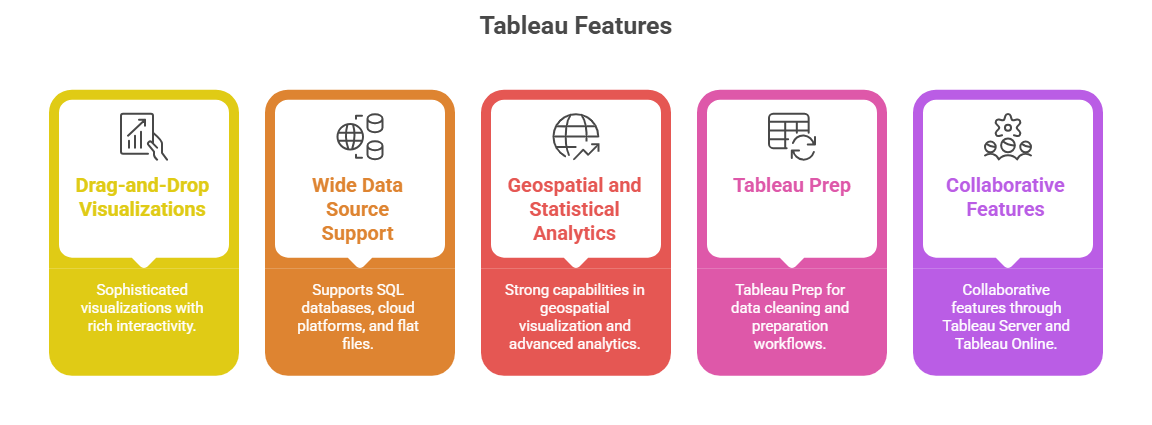
Tableau
Tableau, acquired by Salesforce, is renowned for its intuitive interface and powerful analytics capabilities, making it a favorite among data professionals and analysts.
Ideal For: Data scientists, analysts, and organizations seeking highly customizable visual analytics and storytelling with a focus on exploration and deep insights.
Pricing: Offers Creator, Explorer, and Viewer licenses to tailor costs with role-based capabilities.
Google Data Studio
Google Data Studio is a free, cloud-based tool that excels at easy report and dashboard creation with strong integration into Google’s ecosystem.
Key Features:
1. User-friendly interface optimized for Google Analytics, Google Sheets, Google BigQuery, and other Google services.
2. Real-time collaboration and sharing with Google Drive integration.
3. Variety of built-in charts, tables, and interactive controls like filters and date selectors.
4. Supports custom connectors to third-party databases and applications.
5. Suitable for marketing teams and business users seeking quick, cost-effective reporting solutions.
Ideal For: Small to medium-sized businesses using Google Workspace, marketers, and non-technical users looking for free, straightforward reporting tools.
Pricing: Completely free to use with a Google account.
