Interactive dashboards are powerful tools that condense complex data into intuitive visual displays, enabling diverse audiences to explore, interpret, and act on insights efficiently. Designing these dashboards requires thoughtful consideration of user roles, technical proficiency, and decision-making needs. By balancing clarity, usability, and interactivity, dashboards become accessible to executives, analysts, and operational staff alike, fostering data-driven cultures.
Understanding User Needs and Personas
Effective dashboard design starts with a thorough understanding of the intended audience:
1. Executives and Decision Makers: Require high-level KPIs, trends, and summary views for quick strategic insights.
2. Analysts and Data Scientists: Need detailed, drill-down capabilities and flexible filtering to perform deep analysis.
3. Operational Staff: Benefit from real-time data and notifications to support timely actions.
Defining clear user personas ensures customized content and functionality tailored to each group's priorities and expertise.
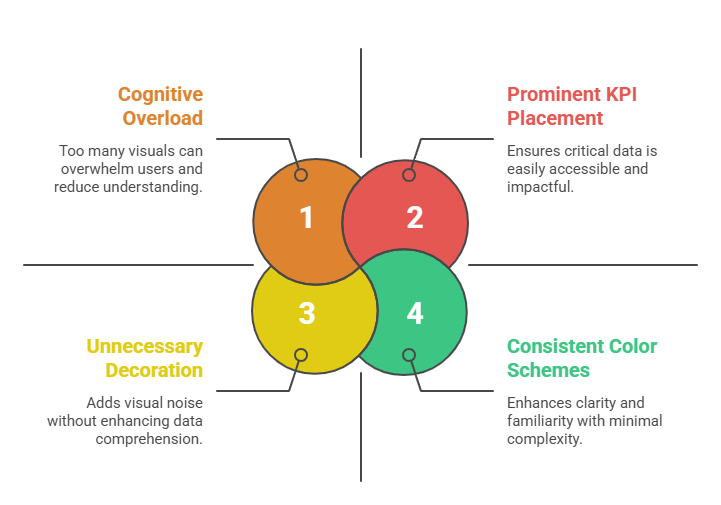
Clarity and Simplicity in Visual Design
Dashboards should present concise, relevant information with a visual hierarchy guiding user focus:
Interactive Features and Usability
Interactivity transforms static dashboards into dynamic exploration platforms:
1. Filters and Drill-Downs: Allow users to customize views and navigate from summaries to details.
2. Responsive Design: Ensure dashboards adapt seamlessly to different devices and screen sizes for accessibility.
3. Tooltips and Annotations: Provide contextual information on demand without cluttering the interface.
4. Real-Time Updates: Enable automatic refreshing to deliver current data for operational decision-making.
5. Keyboard Navigation and Accessibility: Support users relying on assistive technologies.
Storytelling and Data Contextualization
Dashboards should tell a clear, coherent story that highlights key insights:
1. Group related metrics and visuals logically to support user workflows.
2. Use visual cues like color highlights or alert icons to draw attention to anomalies or thresholds.
3. Include explanatory text or captions to clarify complex data points or suggest actions.
4. Maintain consistency in interaction patterns to build user confidence and reduce learning curves.
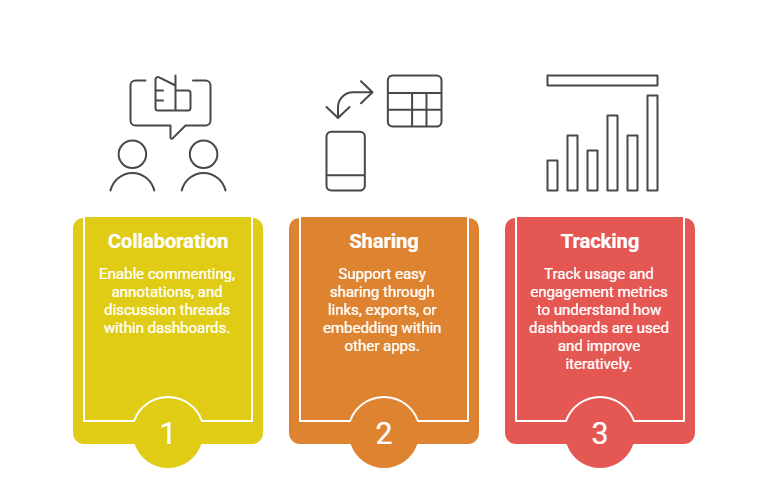
Collaboration and Sharing
Modern interactive dashboards offer collaborative features that foster team alignment:
Performance and Scalability Considerations
Ensure dashboards load quickly and support concurrent users without lag:
1. Optimize data queries and backend performance through indexing and caching.
2. Use lightweight, efficient visualizations suitable for the data volume.
3. Plan for scalable infrastructure, especially for real-time or high-traffic scenarios.
