Amazon CloudWatch is a comprehensive monitoring and observability service offered by AWS that provides real-time insights into application performance, resource utilization, and operational health.
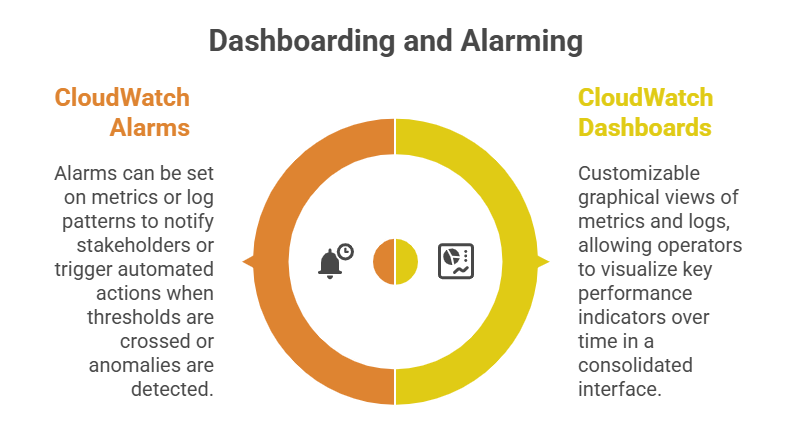
CloudWatch collects and tracks metrics, collects log files, sets alarms, and automatically reacts to changes in AWS resources through customizable dashboards and actions.
By aggregating data across applications and infrastructure, CloudWatch enables organizations to optimize performance, troubleshoot issues, and maintain reliability in complex cloud environments.
Core Metrics in CloudWatch
CloudWatch automatically collects essential metrics from a wide array of AWS services, including Amazon EC2, Lambda, RDS, S3, and more:
1. Compute metrics such as CPU utilization, disk I/O, and network traffic.
2. Database metrics, including throughput, latency, and connections.
3. Storage service metrics like bucket size and request counts.
4. Application-specific custom metrics can also be published to CloudWatch.
The collected metrics allow granular visibility into the behavior and health of infrastructure and applications.
CloudWatch Logs
CloudWatch Logs enables centralized storage, monitoring, and analysis of log data generated by applications, operating systems, and AWS services.
1. Log data is grouped into Log Groups, which contain multiple Log Streams (a sequence of log events).
2. Applications can push logs directly via the CloudWatch API, or AWS services like Lambda and EC2 can be configured to send logs automatically.
3. Logs can be searched and filtered using CloudWatch Logs Insights, a powerful query language optimized for fast, interactive analysis.
4. Subscription filters allow forwarding log data to other AWS services, such as Amazon Elasticsearch or Lambd,a for advanced processing or alerting.

Extended Features
1. Metric Filters: Extract structured data from log events to generate real-time CloudWatch metrics.
2. Anomaly Detection: Uses machine learning models to detect unusual metric behavior automatically.
3. Contributor Insights: Helps identify top contributors to system bottlenecks or errors by analyzing logs and metrics.
Benefits of Using CloudWatch
CloudWatch empowers organizations to monitor, visualize, and automate actions across their AWS environments. Here are the major benefits that highlight its role in ensuring performance and reliability.
1. Unified platform for monitoring diverse AWS resources and applications.
2. Automates operational response via alarms and event-driven actions.
3. Enables proactive issue detection and rapid root cause analysis.
4. Supports compliance through detailed audit trails and retention of metrics/logs.
5. Scales with cloud workloads, supporting high data volumes with low latency.
.png)
Class Sessions
Sales Campaign

We have a sales campaign on our promoted courses and products. You can purchase 1 products at a discounted price up to 15% discount.
