Monitoring application health and performance in production is essential to ensure reliable, secure, and scalable operations.
As applications grow more complex, production monitoring moves beyond simple uptime checks to encompass deep insights into system responsiveness, resource utilization, user experience, and error conditions.
In AWS, a combination of managed services and best practices empowers teams to proactively detect issues, remediate outages, and optimize operational performance.
Principles of Application Monitoring
A well-structured monitoring framework helps teams identify anomalies, prevent downtime, and optimize performance in real time. Below are the core principles that support robust observability and automated remediation.
1. Define Clear Metrics and Objectives
Identify key performance indicators (KPIs) relevant to your application and business goals—such as response time, error rate, latency, and resource usage.
Service level objectives (SLOs) should be set to align internal metrics with customer-facing service level agreements (SLAs), helping teams track reliability and performance against expectations.
2. Automate Data Collection and Alerts: Leverage AWS monitoring tools to automate the collection, aggregation, and analysis of logs and metrics.
Amazon CloudWatch: Centralizes metric and log collection from nearly all AWS services.
CloudWatch Dashboards: Provide visual overviews of resource health, application errors, and custom KPIs.
CloudWatch Alarms: Notify stakeholders of anomalies (e.g., high CPU, increased latency, error spikes) and can trigger remediation workflows through SNS or Lambda functions.
3. Implement Health Checks
Design and use health checks that accurately reflect application status—such as checking for HTTP responses, latency thresholds, and database connectivity.
Route 53 and Elastic Load Balancing offer integrated health checks, and custom metrics can be published to CloudWatch for more nuanced indicators.
4. Use Distributed Tracing and Synthetic Monitoring
Employ distributed tracing tools like AWS X-Ray to map service dependencies and analyze slow or failed transactions across microservices.
Use CloudWatch Synthetics to simulate user interactions and monitor endpoint availability and performance proactively.
5. Aggregate and Analyze Logs: Centralize application logs using CloudWatch Logs to support diagnostics, root cause analysis, and compliance. Aggregation and indexing enable quick correlation of incidents and visibility into operational trends, especially in large environments.
6. Automate Responses and Remediation
Automated responses (such as scaling policies, failover, or function invocation) minimize human intervention and speed up recovery from issues detected via metrics and logs.
Regularly review automation workflows to verify they trigger at appropriate thresholds and do not produce excessive alerts.
7. Test and Refine: Continuously validate monitoring settings, health checks, and alert thresholds in staging and production environments. This ensures that alerts are actionable, relevant, and do not create unnecessary noise.
Best Practices for Monitoring in AWS
AWS offers powerful tools to track system health, performance, and user experience. These best practices highlight how to leverage monitoring effectively for better visibility, faster troubleshooting, and optimized operations.
1. Create custom dashboards for each application or environment.
2. Use synthetic monitoring to simulate user experiences and catch downtime before users do.
3. Map dependencies among services and monitor their interactions for bottlenecks.
4. Aggregate logs for efficient troubleshooting and security analysis.
5. Set actionable, clear alert thresholds tailored to workload specifics.
6. Automate remediation to address issues rapidly and reduce operational overhead.
7. Monitor across all accounts and regions for complete environment visibility.
8. Review and refine monitoring goals and processes as the application evolves.
Tools for Monitoring Application Health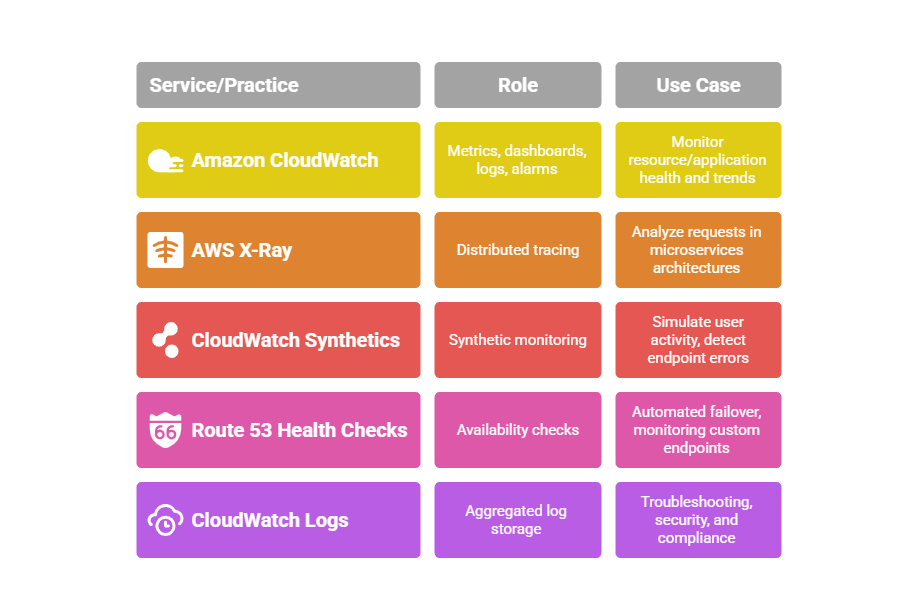

Class Sessions
Sales Campaign

We have a sales campaign on our promoted courses and products. You can purchase 1 products at a discounted price up to 15% discount.