Collecting metrics and logs is valuable, but the real operational power comes from what you do with that data.
Alerts ensure that the right people are notified the moment something requires attention, without anyone having to watch dashboards continuously.
Observability is the broader capability that determines how well a team can understand the internal state of their systems from the outside, using metrics, logs, and traces together to answer not just "is something wrong?" but "why is it wrong and where?"
Together, alerting and observability close the loop between running software and understanding it, transforming monitoring from passive data collection into an active, intelligent operational practice.
What is Alerting?
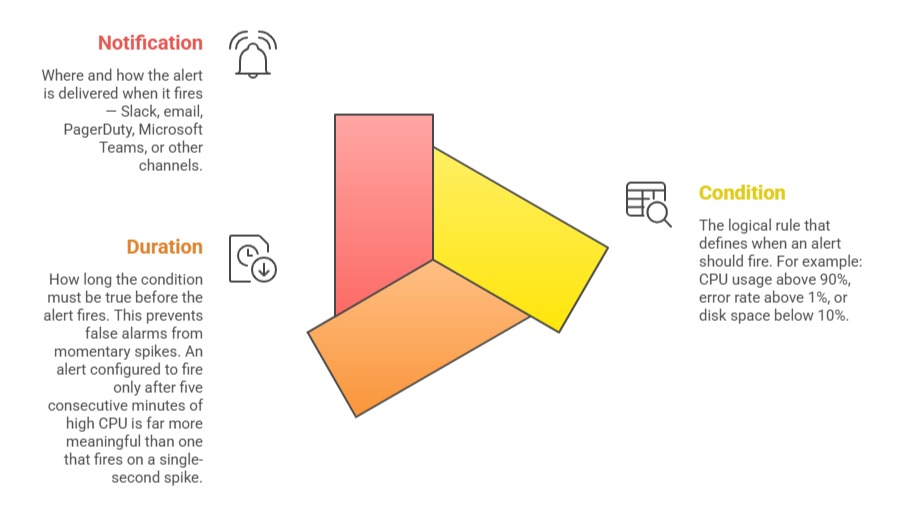
An alert is an automated notification triggered when a monitored metric or condition crosses a defined threshold.
Rather than requiring engineers to continuously watch dashboards, alerts proactively notify the right people the moment a problem emerges — or better still, before it becomes a user-facing incident.
Alerting bridges the gap between monitoring data and human action. A metric showing CPU at 95% is just a number, an alert that sends that information to an engineer's phone at 2am is what prevents a production outage.
How Alerts Work
Every alert is built on three core components:
Alerting with Prometheus and Alertmanager
In the Prometheus ecosystem, alerting is split between two components:
Prometheus evaluates alert rules continuously against collected metrics. When a rule condition is satisfied for the defined duration, Prometheus fires the alert and sends it to Alertmanager.
Alertmanager receives fired alerts and handles routing, grouping, silencing, and delivery to notification channels.
A basic Prometheus alert rule:
yaml
groups:
- name: application-alerts
rules:
- alert: HighErrorRate
expr: rate(http_requests_total{status=~"5.."}[5m]) > 0.05
for: 5m
labels:
severity: critical
annotations:
summary: "High HTTP error rate detected"
description: "More than 5% of requests are returning 5xx errors"
- alert: LowDiskSpace
expr: node_filesystem_avail_bytes / node_filesystem_size_bytes * 100 < 10
for: 10m
labels:
severity: warning
annotations:
summary: "Disk space below 10%"
A basic Alertmanager configuration that routes critical alerts to Slack:
yaml
route:
receiver: 'slack-notifications'
group_by: ['alertname', 'severity']
receivers:
- name: 'slack-notifications'
slack_configs:
- api_url: 'https://hooks.slack.com/services/YOUR/SLACK/WEBHOOK'
channel: '#alerts'
text: '{{ .CommonAnnotations.description }}'
Alert Severity Levels
Not all alerts are equally urgent. Defining severity levels helps teams prioritize their response:
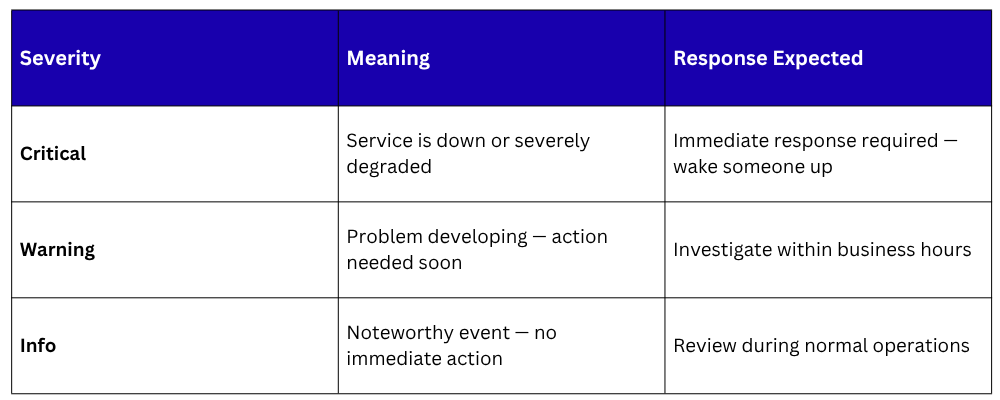
Severity labels on alert rules enable Alertmanager to route different alerts to different channels — critical alerts to PagerDuty for immediate on-call escalation, warnings to a Slack channel for review during business hours.
Alert Fatigue — The Most Common Alerting Problem
Alert fatigue occurs when teams receive so many alerts, many of them false positives or low-priority notifications — that they begin to ignore them.
This is one of the most dangerous operational problems a team can face, a genuine critical alert buried in a flood of noise may go unnoticed until users are already impacted.
Preventing alert fatigue requires:
1. Alert only on actionable conditions: Every alert should require a human response. If no action is needed, it should not be an alert.
2. Use appropriate durations: Require conditions to persist for a meaningful period before firing, reducing noise from momentary fluctuations.
3. Group related alerts: Alertmanager can group multiple related alerts into a single notification to prevent flooding.
4. Regularly review and prune alert rules: Remove or adjust alerts that consistently fire without requiring action.
5. Use inhibition rules: Suppress lower-severity alerts when a higher-severity alert for the same system is already active.
What is Observability?
Observability is a measure of how well the internal state of a system can be understood from its external outputs.
The term comes from control systems engineering, but in DevOps it has become the overarching philosophy for how modern systems should be designed, instrumented, and operated.
A system is considered observable when engineers can answer any question about its behavior using the data it produces — without needing to add new instrumentation or deploy a new version just to investigate a problem.
Observability is built on three pillars:
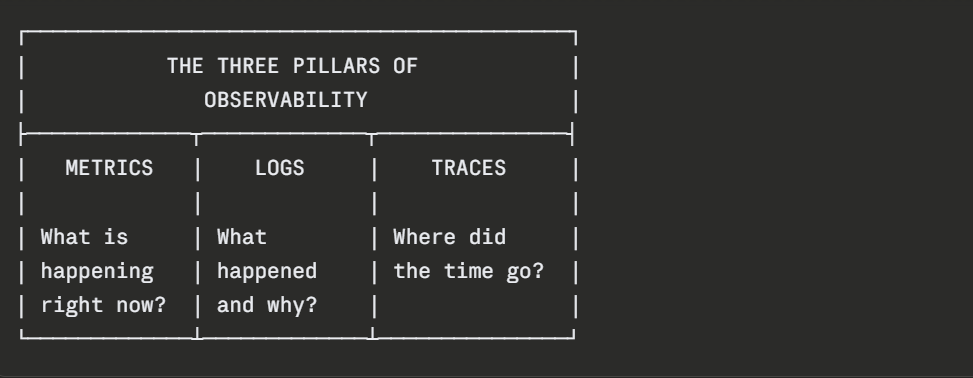
The Three Pillars of Observability
Metrics
Numerical time-series data that provides a high-level view of system performance and health. Metrics are efficient to store and query, making them ideal for dashboards and alerting. They answer questions like — what is the current error rate? How has CPU usage trended over the last 24 hours?
Logs
Timestamped records of discrete events that provide detailed context about what happened inside a system. When a metric alert fires, logs are what engineers turn to for the specific details that explain the cause.
Traces
In distributed systems with multiple services, a single user request travels through many components.
Distributed tracing tracks the complete path of a request, recording how long each service took to process it and where failures or slowdowns occurred. Tools like Jaeger and Zipkin provide distributed tracing capabilities.
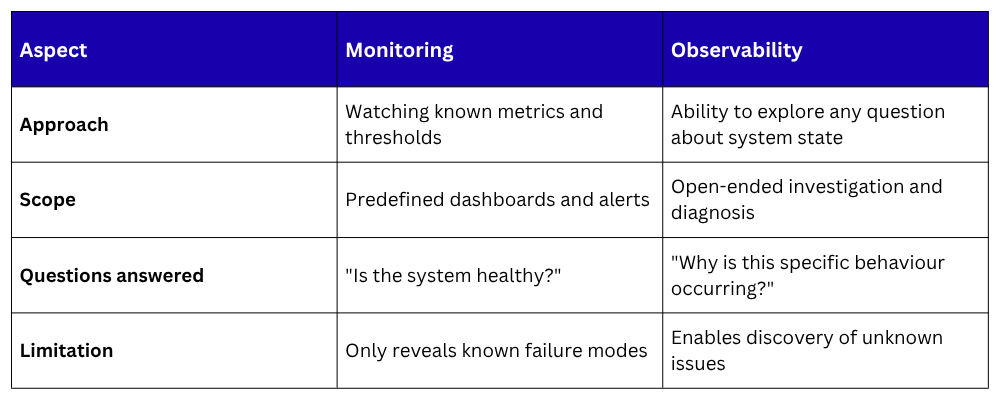
Monitoring vs. Observability
These terms are related but not identical, and the distinction matters:
For teams beginning their observability journey, the following foundation covers the most critical ground:
Step 1 — Instrument applications
Ensure every service exposes metrics through a /metrics endpoint using a Prometheus client library, and emits structured logs with consistent fields — timestamps, log levels, service names, and request IDs.
Step 2 — Deploy Prometheus and Grafana
Set up Prometheus to scrape all services and infrastructure. Deploy Grafana and connect it to Prometheus. Import pre-built dashboards for common systems — Node Exporter, Kubernetes, databases.
Step 3 — Define alerts for the Four Golden Signals
Create alert rules covering latency, traffic, errors, and saturation for every critical service. Configure Alertmanager to route alerts to appropriate channels based on severity.
Step 4 — Centralize logs
Deploy a log aggregation solution, the ELK Stack or Grafana Loki — to collect logs from all services into a single searchable location. Ensure structured logging is consistent across all applications.
Step 5 — Establish an on-call process
Define who receives critical alerts, what the response procedure is, and how incidents are documented and reviewed. Observability tooling is only as effective as the human process built around it.

Class Sessions
Sales Campaign

We have a sales campaign on our promoted courses and products. You can purchase 1 products at a discounted price up to 15% discount.