Two foundational pillars of any monitoring strategy are metrics and logs. Metrics are the numbers that tell you how a system is performing — response times, error rates, CPU usage, and request throughput.
Logs are the detailed records that tell you what actually happened inside a system — event by event, with timestamps and context.
Together, metrics and logs provide complementary views of system health: metrics reveal that something is wrong, and logs help explain why.
What are Metrics?
A metric is a numerical value measured at a point in time that represents some aspect of a system's state or behavior.
Metrics are collected repeatedly at regular intervals, every few seconds or minutes and stored in a time-series database that preserves the history of how each value changed over time.
This time-based nature is what makes metrics powerful. A single CPU reading of 85% tells you very little. A graph showing CPU gradually climbing from 20% to 85% over the past two hours tells a story, something changed, and it is worth investigating.
Metrics are the primary input for dashboards, alerts, and capacity planning decisions.
Types of Metrics
1. Counter
A counter is a metric that only ever increases, it counts occurrences of an event over time. Counters are reset to zero when a service restarts.
Examples: total HTTP requests served, total errors thrown, total bytes transmitted.
Counters are most useful when analyzed as a rate — requests per second, errors per minute — rather than as a raw cumulative number.
2. Gauge
A gauge is a metric that can go up or down, it represents the current value of something at a moment in time.
Examples: current CPU usage percentage, current memory consumption, number of active connections, current queue depth.
Gauges answer the question "what is the value right now?"
3. Histogram
A histogram samples observations and counts them into configurable buckets, allowing the distribution of values to be analyzed. Histograms are commonly used to measure request durations and response sizes.
Examples: how many requests completed in under 100ms, between 100ms and 500ms, and over 500ms.
4. Summary
Similar to a histogram but calculates percentiles directly, such as the 50th, 90th, and 99th percentile of request durations. Summaries are particularly useful for understanding the experience of different segments of users.
The Golden Signals — The Four Metrics That Matter Most
The Four Golden Signals, originally defined by Google's Site Reliability Engineering team — represent the four most critical metrics for understanding the health of any service. If you can only monitor four things, these are the four to choose.
1. Latency
The time it takes to service a request — how long users wait for a response. It is important to measure latency for both successful and failed requests separately, since failures that return immediately can mask poor performance.
Target: Track the p50 (median), p90, and p99 latency values. The p99 value — the slowest 1% of requests — often reveals the worst user experiences that averages hide.
2. Traffic: The volume of demand being placed on the system — requests per second, queries per second, or transactions per minute. Traffic metrics establish a baseline and help identify unexpected spikes or drops.
3. Errors: The rate at which requests fail, either explicitly (HTTP 500 responses) or implicitly (responses that are technically successful but return incorrect results). Error rate is one of the most direct indicators of service degradation.
4. Saturation: How full or constrained the system's resources are CPU utilization, memory usage, disk I/O, and network bandwidth. Saturation metrics indicate how close a system is to its limits and predict problems before they become outages.
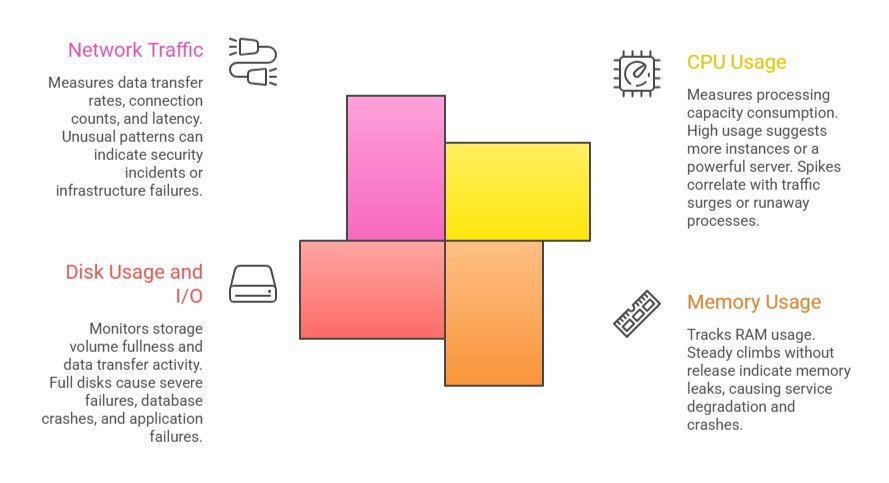
Key Infrastructure Metrics
Beyond application-level signals, infrastructure metrics track the health of the underlying servers and platforms:
What are Logs?
A log is a timestamped, text-based record of a discrete event that occurred within an application or system. Where metrics show trends and patterns, logs provide the specific detail needed to understand exactly what happened at a particular moment.
Every time an application handles a request, throws an error, connects to a database, or performs a significant action, it can write a log entry describing that event. These entries accumulate into log files or log streams that can be searched, filtered, and analyzed.
A typical log entry contains:
1. Timestamp — When the event occurred.
2. Log level — The severity of the event.
3. Message — A description of what happened.
4. Context — Additional data such as user ID, request ID, service name, or error stack trace.
Example log entry:

Log Levels — Understanding Severity
Log levels indicate the severity and nature of a logged event. Most logging frameworks use a standard hierarchy of levels:
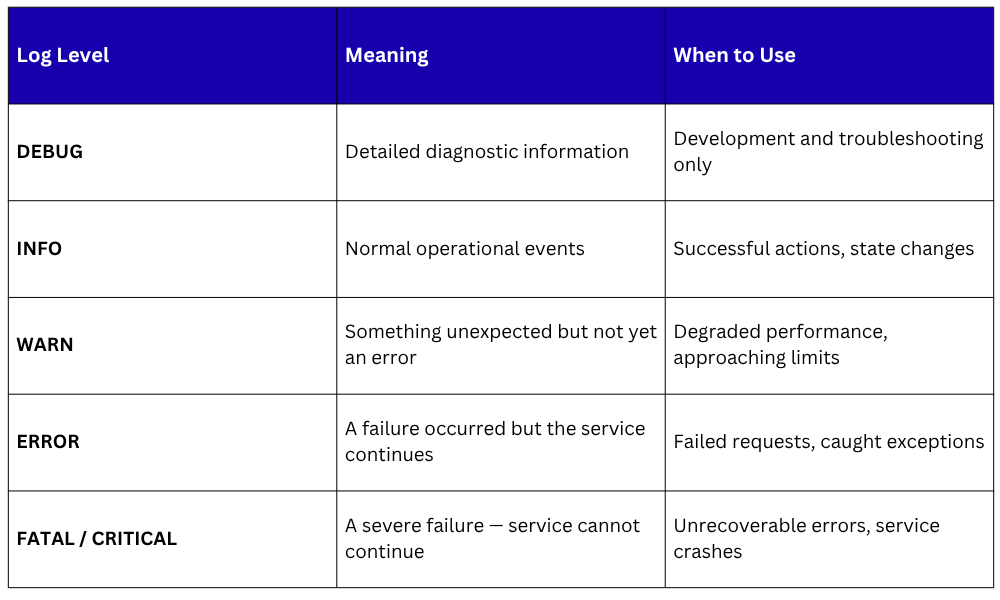
In production environments, DEBUG logs are typically disabled to avoid generating excessive volume. ERROR and WARN logs are the primary focus of operational monitoring and alerting.
Structured Logging
Traditional log messages are plain text, readable by humans but difficult to parse and search automatically. Structured logging formats log entries as JSON or key-value pairs, making every field individually searchable and filterable by log management tools.
Unstructured log entry:

Structured log entry:
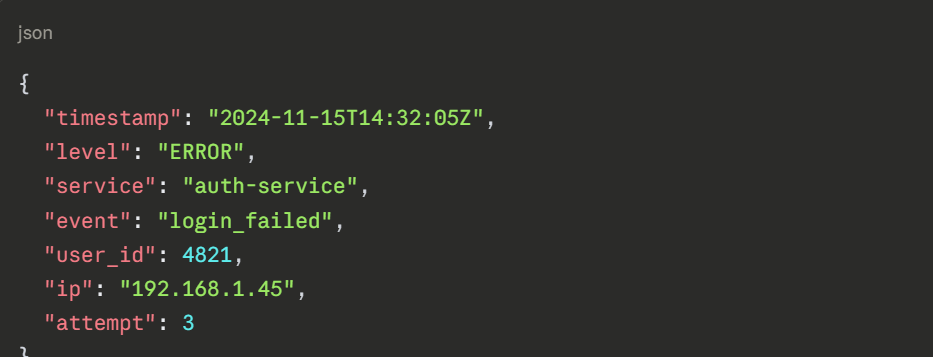
Structured logs can be queried precisely — "show me all login failures from IP 192.168.1.45 in the last hour" — making investigation dramatically faster and more effective.
Log Management — Collection, Aggregation, and Analysis
In modern environments with many services and servers, logs are generated in enormous volumes across dozens of sources simultaneously.
Managing them effectively requires a centralized log management system that collects, stores, and makes all logs searchable in one place.
The most widely used open-source log management stack is the ELK Stack:
1. Elasticsearch: A distributed search and analytics engine that stores logs and makes them queryable at scale.
2. Logstash: A data processing pipeline that collects logs from various sources, transforms them, and forwards them to Elasticsearch.
3. Kibana: A visualization interface for searching, filtering, and building dashboards from log data stored in Elasticsearch.
An alternative to Logstash for lightweight log collection is Filebeat, a lightweight agent installed on servers that ships log files to Elasticsearch or Logstash with minimal resource overhead.
Other popular log management platforms include Grafana Loki, a log aggregation system designed to work alongside Prometheus, and Datadog Logs, which provides a fully managed commercial solution.
Metrics vs. Logs
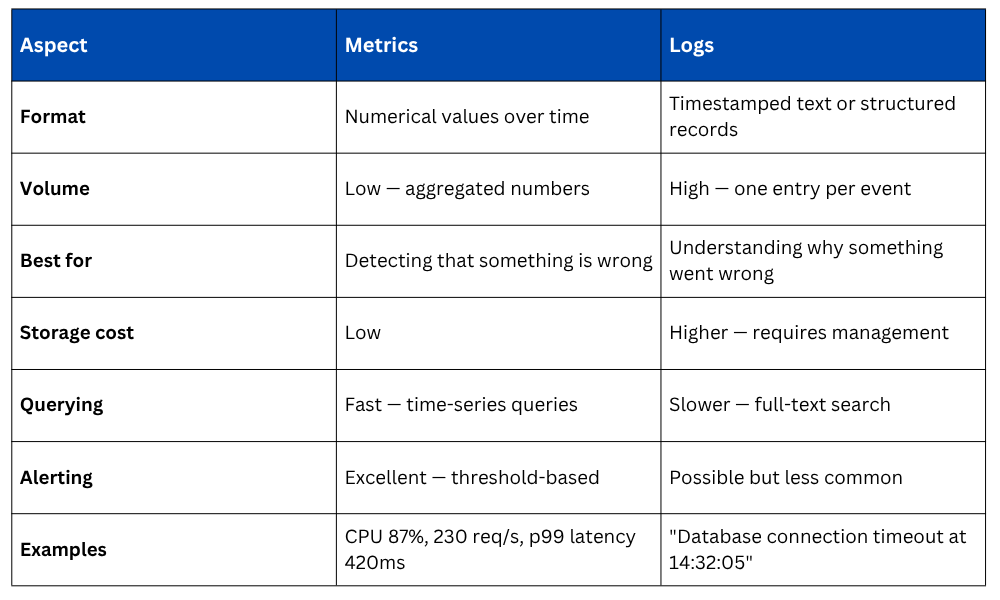
Metrics and logs are not competing approaches, they are complementary. In practice, the workflow is almost always the same: a metric alert fires indicating something is wrong, and engineers then search the logs to find the specific events that explain the cause.
Best Practices for Metrics and Logging
1. Monitor the Four Golden Signals first: Latency, traffic, errors, and saturation cover the most critical ground for any service.
2. Use structured logging consistently: JSON-formatted logs are dramatically easier to search and analyze than plain text.
3. Set meaningful alert thresholds: Alerts should fire when action is genuinely required, not on every minor fluctuation. Too many alerts cause alert fatigue.
4. Include correlation IDs in logs: A unique ID attached to every request and included in all related log entries makes tracing the flow of a specific request through multiple services straightforward.
5. Define log retention policies: Logs consume storage rapidly. Define how long different log levels are retained based on operational and compliance requirements.
6. Review and refine dashboards regularly: Dashboards should evolve as systems change. Outdated dashboards that no longer reflect reality create false confidence.

Class Sessions
Sales Campaign

We have a sales campaign on our promoted courses and products. You can purchase 1 products at a discounted price up to 15% discount.