Once software is running in production and real users are depending on it, the critical question becomes: how do you know it is working? This is where monitoring becomes indispensable.
Monitoring is the practice of continuously observing the health, performance, and behavior of systems, applications, and infrastructure — collecting data, detecting problems, and providing the visibility teams need to keep everything running reliably.
In modern DevOps, monitoring is not an afterthought bolted on after deployment, it is a core discipline woven into every stage of the delivery pipeline.
What is Monitoring?
Monitoring is the continuous process of collecting, analyzing, and acting on data from running systems. It answers questions that are critical to operating software reliably:
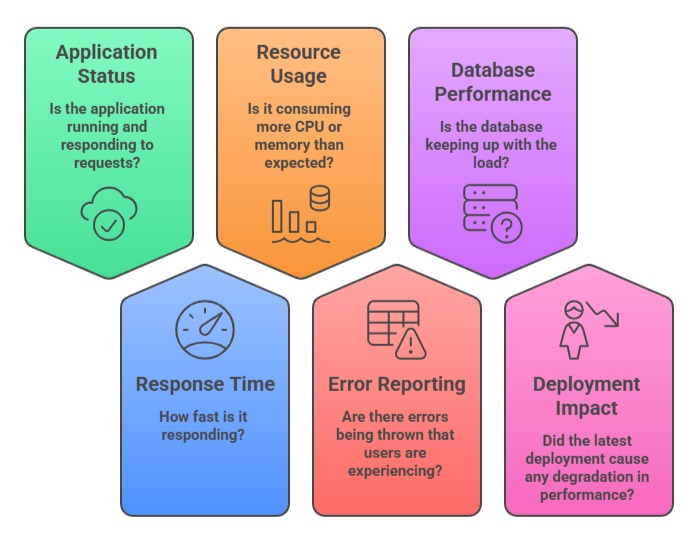
Monitoring translates raw system data into actionable insight, giving engineering teams the information they need to detect problems early, diagnose issues quickly, and make informed decisions about their infrastructure and applications.
Why Monitoring is Critical in DevOps
In a DevOps environment, teams deploy frequently, systems are complex, and user expectations for availability are high. Monitoring is what makes it possible to operate confidently in this environment.
1. Early Problem Detection
Without monitoring, problems are discovered when users complain by which point the damage is already done. With monitoring, teams detect anomalies the moment they emerge, often before any user is affected.
A spike in error rates, a sudden drop in response speed, or an unusual surge in memory usage can all be detected and investigated immediately.
2. Reduced Mean Time to Detect and Resolve (MTTD / MTTR)
Two of the most important operational metrics in DevOps are Mean Time to Detect (MTTD) — how long it takes to discover a problem, and Mean Time to Resolve (MTTR) — how long it takes to fix it.
Monitoring directly improves both. When systems emit real-time data and alerts fire automatically, detection happens in seconds rather than hours. When dashboards show exactly where the problem is, resolution is faster and more precise.
3. Validating Deployments
Every deployment carries risk. Monitoring provides immediate feedback after a release — confirming whether the new version is performing as expected or showing signs of regression.
Teams can compare pre- and post-deployment metrics and make data-driven decisions about whether to continue the rollout or roll back.
4. Capacity Planning
Monitoring historical data reveals trends in resource usage over time — CPU growing steadily, storage filling up, database connections approaching their limit.
These trends allow teams to plan infrastructure capacity proactively — scaling before problems occur rather than reacting to outages.
5. Ensuring SLAs and SLOs
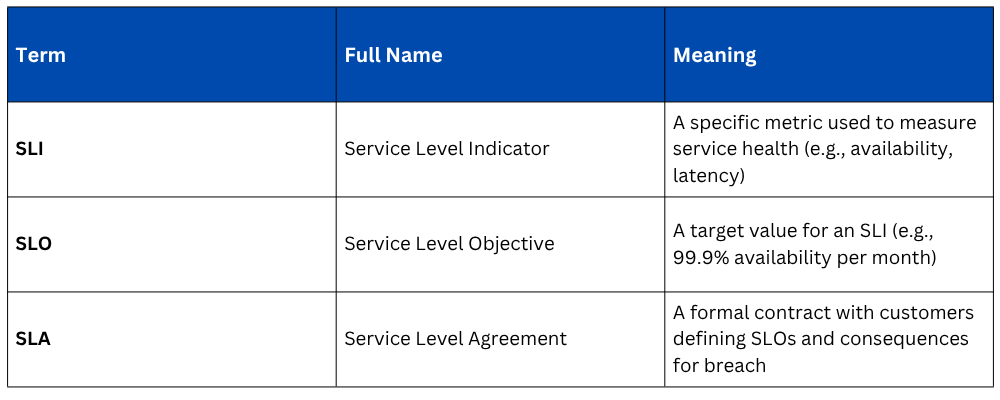
Organizations make commitments to customers about system availability and performance — expressed as Service Level Agreements (SLAs) and Service Level Objectives (SLOs).
Monitoring is the mechanism through which compliance with these commitments is measured, reported, and enforced.
6. Supporting Continuous Improvement
Monitoring data is not just for emergencies, it informs ongoing improvement.
Performance bottlenecks, inefficient resource usage, and recurring error patterns all become visible through monitoring, giving teams a data-driven basis for prioritizing improvements and optimizations.
What Monitoring Covers
Effective monitoring in a DevOps environment covers multiple layers, each providing a different perspective on system health.
1. Infrastructure Monitoring
Tracks the health and performance of the underlying hardware and virtual machines — CPU usage, memory consumption, disk I/O, network throughput, and server availability. Infrastructure monitoring ensures the platform on which applications run is healthy and adequately resourced.
2. Application Performance Monitoring (APM)
Monitors the behavior of the application itself — response times, request rates, error rates, database query performance, and transaction throughput. APM gives teams insight into how the application is performing from the user's perspective.
3. Network Monitoring
Tracks network traffic, latency between services, packet loss, and connectivity between components. In distributed systems and microservices architectures, network monitoring is essential for identifying communication failures between services.
4. Log Monitoring
Collects and analyzes log data generated by applications and infrastructure components. Logs provide the detailed narrative of what happened inside a system, complementing metrics by explaining why something went wrong, not just that something went wrong.
Key Monitoring Concepts
Metrics
Metrics are numerical measurements collected at regular intervals over time — CPU percentage, requests per second, response latency in milliseconds.
They are the primary data type used in infrastructure and application monitoring, stored in time-series databases that make it easy to observe how values change over time.
Logs
Logs are timestamped records of discrete events that occurred within a system — an error thrown by an application, a user authentication event, a database query executed. Logs provide context and detail that metrics alone cannot capture.
Traces
In distributed systems and microservices, a single user request might pass through many services.
Distributed tracing tracks the full journey of a request across all services, showing exactly where time was spent and where failures occurred. This is particularly valuable for diagnosing latency issues in complex architectures.
Alerts
An alert is an automated notification triggered when a metric crosses a defined threshold. For example, when CPU usage exceeds 90% for five consecutive minutes, or when the error rate rises above 1%.
Alerts are the bridge between monitoring data and human action — notifying the right people at the right time when something requires attention.
Dashboards
Dashboards provide visual representations of monitoring data — graphs, charts, and gauges that give teams at-a-glance visibility into system health.
Well-designed dashboards communicate the state of a system in seconds, without requiring engineers to query raw data manually.
SLI, SLO, and SLA
The Cost of Not Monitoring
Teams that operate without adequate monitoring consistently experience the same painful patterns:
1. Reactive operations: Problems are discovered through user complaints rather than proactive detection, always arriving as surprises.
2. Long outages: Without visibility into where a problem originated, diagnosis takes hours instead of minutes.
3. Repeated incidents: Without data from past incidents, the same failures recur because root causes are never properly identified and addressed.
4. Unsafe deployments: Without post-deployment monitoring, teams cannot tell whether a release degraded performance until users have already been affected.
5. Capacity surprises: Without trend data, resource exhaustion comes without warning — disks fill up, memory runs out, and databases hit connection limits during peak traffic.
Monitoring in the DevOps Lifecycle
Monitoring is not confined to the operations phase, it connects to every stage of the DevOps lifecycle:
1. During development: Performance benchmarks and test coverage metrics are tracked.
2. In CI/CD pipelines: Build times, test pass rates, and deployment frequencies are monitored.
3. After deployment: Application and infrastructure metrics are observed to validate releases.
4. In production: Continuous monitoring detects incidents, tracks SLOs, and informs capacity decisions.
5. During incidents: Monitoring data is the primary tool for diagnosing root causes and verifying that fixes resolve the problem.
6. Post-incident: Historical monitoring data supports post-mortem analysis and prevention planning.
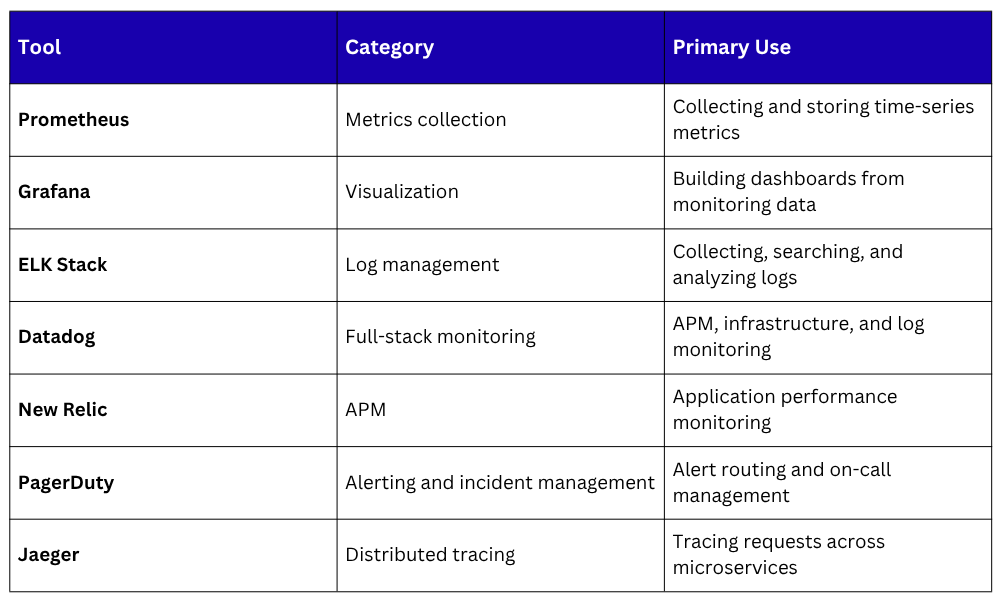
Popular Monitoring Tools in DevOps

Class Sessions
Sales Campaign

We have a sales campaign on our promoted courses and products. You can purchase 1 products at a discounted price up to 15% discount.