Two tools have emerged as the most widely adopted open-source monitoring combination in the DevOps and cloud-native ecosystem: Prometheus and Grafana.
Prometheus handles the collection and storage of metrics — continuously scraping data from applications and infrastructure and storing it in a time-series database.
Grafana takes that data and transforms it into rich, interactive dashboards that give teams immediate visual insight into system health.
Together, they form a powerful, flexible, and cost-effective monitoring stack that is used by organizations of every size — from startups to large enterprises, and is particularly well-suited to Kubernetes environments.
What is Prometheus?
Prometheus is an open-source monitoring and alerting toolkit originally developed at SoundCloud in 2012 and donated to the Cloud Native Computing Foundation (CNCF) in 2016 — the same foundation that oversees Kubernetes.
It is now one of the most widely deployed monitoring tools in the cloud-native world.
Prometheus is designed specifically for reliability and simplicity, it operates as a standalone server that collects metrics, stores them locally, evaluates alert rules, and exposes a powerful query interface.
It does not depend on distributed storage or complex external systems, making it robust and straightforward to operate.
Key characteristics of Prometheus:
1. Pull-based metrics collection: Prometheus actively scrapes metrics from targets at defined intervals, rather than waiting for targets to push data to it.
2. Time-series data model: All metrics are stored as time-series — sequences of timestamped numerical values identified by a metric name and a set of key-value labels.
3. Powerful query language: Prometheus provides PromQL (Prometheus Query Language) for querying and aggregating metric data.
4. Built-in alerting: Alert rules are defined in Prometheus and evaluated continuously; alerts are dispatched through the Alertmanager component.
5. Service discovery: Prometheus automatically discovers monitoring targets in dynamic environments like Kubernetes without requiring manual configuration for each new service.
How Prometheus Works
Prometheus operates on a pull model — a design choice that distinguishes it from many other monitoring systems.
Rather than having each application push its metrics to a central collector, Prometheus periodically sends HTTP requests to each monitored target to scrape (collect) its current metrics.
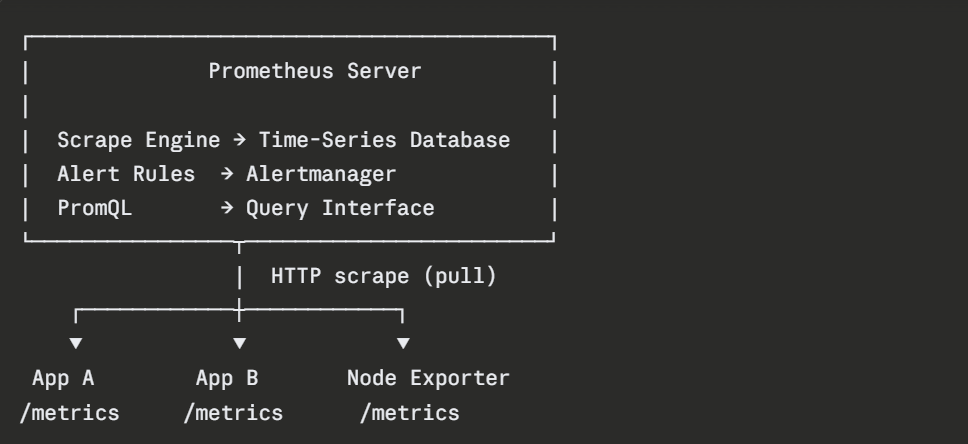
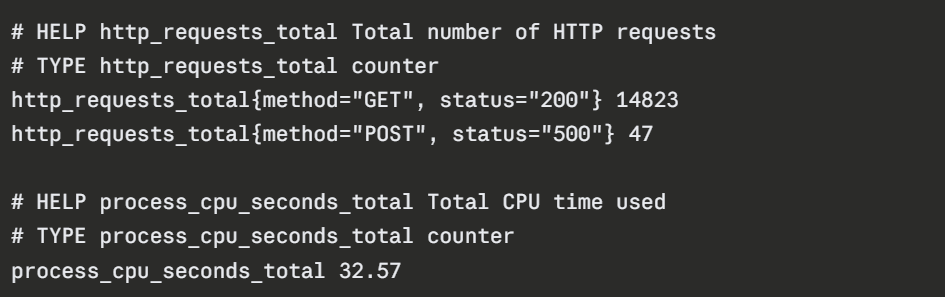
Each monitored application or system exposes a /metrics HTTP endpoint that Prometheus scrapes at a configured interval — typically every 15 to 30 seconds. The metrics endpoint returns data in the Prometheus exposition format — a simple, human-readable text format.
A typical metrics endpoint response looks like this:
Prometheus Exporters
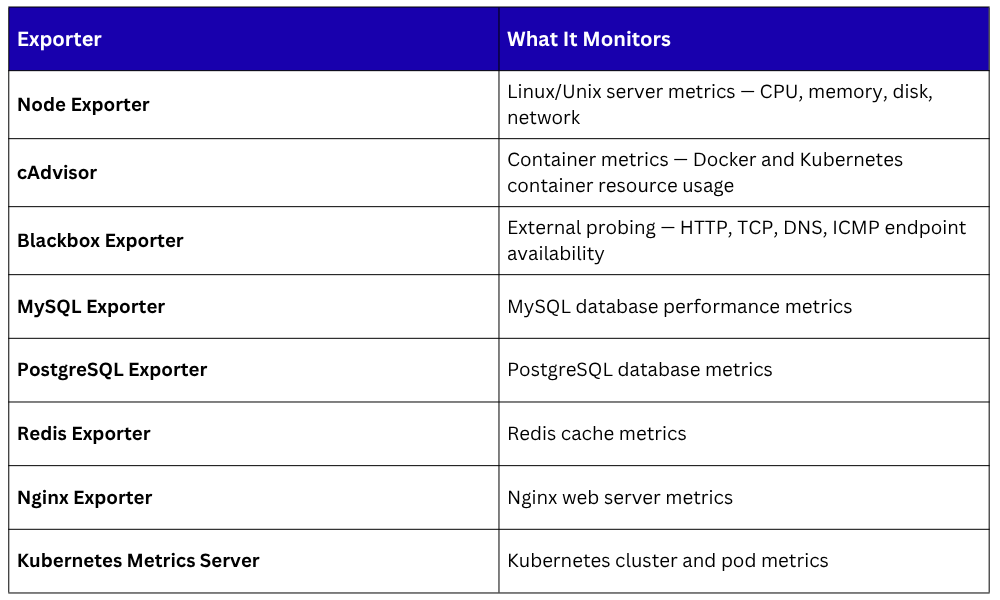
Not every application natively exposes a Prometheus-compatible /metrics endpoint. Exporters solve this, they are small agents that run alongside a system, collect its metrics, and expose them in Prometheus format for scraping.
There are exporters available for virtually every common system and application:
For custom applications, Prometheus provides client libraries for all major programming languages — Go, Python, Java, Node.js, Ruby, and more — allowing developers to instrument their applications directly and expose custom metrics.
PromQL — Querying Prometheus Data
PromQL (Prometheus Query Language) is the powerful, flexible language used to query, filter, and aggregate metric data stored in Prometheus. It is used to build dashboards in Grafana, define alert conditions, and explore metrics during incident investigations.
Some practical PromQL examples:
Querying the current CPU usage across all nodes:

Calculating the HTTP error rate over the last 5 minutes:

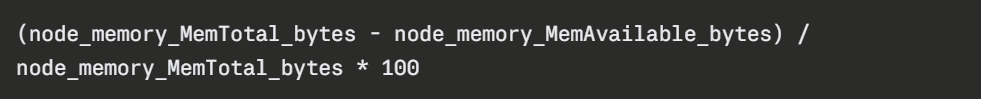
Measuring the percentage of memory in use:
Prometheus Configuration
Prometheus is configured through a YAML file — prometheus.yml that defines the scrape targets, intervals, and any additional settings.
A basic Prometheus configuration:
yaml
global:
scrape_interval: 15s
evaluation_interval: 15s
scrape_configs:
- job_name: 'prometheus'
static_configs:
- targets: ['localhost:9090']
- job_name: 'node-exporter'
static_configs:
- targets: ['node1:9100', 'node2:9100']
- job_name: 'web-application'
static_configs:
- targets: ['app-server:8080']
This configuration tells Prometheus to:
1. Scrape metrics every 15 seconds from all defined targets.
2. Monitor itself at localhost:9090.
3. Collect Node Exporter metrics from two servers.
4. Scrape the web application metrics endpoint.
What is Grafana?
Grafana is an open-source data visualization and analytics platform that transforms raw monitoring data — from Prometheus and many other sources, into rich, interactive, and visually compelling dashboards.
While Prometheus excels at collecting and storing metrics, its built-in visualization interface is minimal and primarily useful for ad-hoc queries.
Grafana fills this gap with a professional-grade visualization layer that allows teams to build dashboards tailored to their specific operational needs.
Key characteristics of Grafana:
1. Multi-source: Connects to Prometheus, Elasticsearch, InfluxDB, MySQL, PostgreSQL, CloudWatch, and dozens of other data sources simultaneously.
2. Rich visualizations: Time-series graphs, bar charts, heatmaps, stat panels, gauges, tables, and more.
3. Interactive dashboards: Time range selection, variable-based filtering, and drill-down capabilities.
4. Alerting: Define alert rules directly in Grafana and route notifications to Slack, PagerDuty, email, and other channels.
5. Pre-built dashboard library: Grafana.com hosts thousands of community-built dashboards for common systems that can be imported instantly.
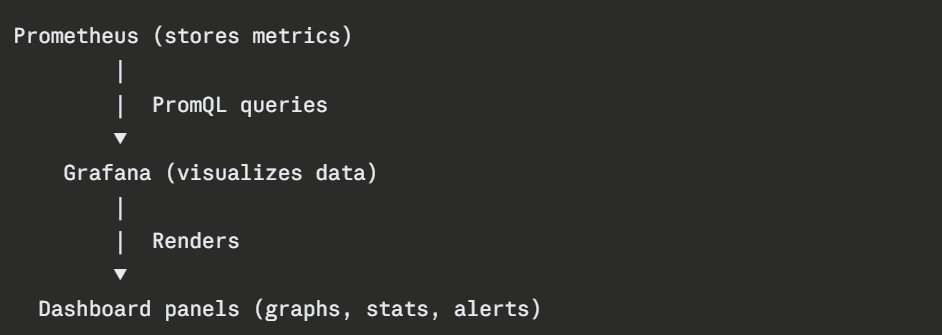
How Grafana Works
Grafana itself does not store metrics, it connects to existing data sources and queries them on demand. The workflow is straightforward:
A data source is configured in Grafana by providing the Prometheus server URL and any authentication details. Grafana then uses PromQL to query Prometheus and renders the results as visualizations on dashboards.
Building a Dashboard Panel
In Grafana, a dashboard consists of multiple panels, each panel displays one or more visualizations powered by a query. Creating a panel involves:
1. Selecting the data source (Prometheus).
2. Writing a PromQL query to retrieve the desired metric.
3. Choosing a visualization type (time-series graph, gauge, stat, table).
4. Configuring axes, legends, thresholds, and display options.
For example, a panel showing HTTP request rate over time would use a PromQL query like:

Grafana renders this as a time-series graph showing how request volume changes over time, instantly revealing traffic patterns, spikes, and drops.
Pre-Built Dashboards
One of Grafana's most practical features is its library of pre-built community dashboards available at grafana.com/grafana/dashboards.
These dashboards cover virtually every common monitoring use case and can be imported into any Grafana instance in seconds using a dashboard ID.
Widely used pre-built dashboards include:
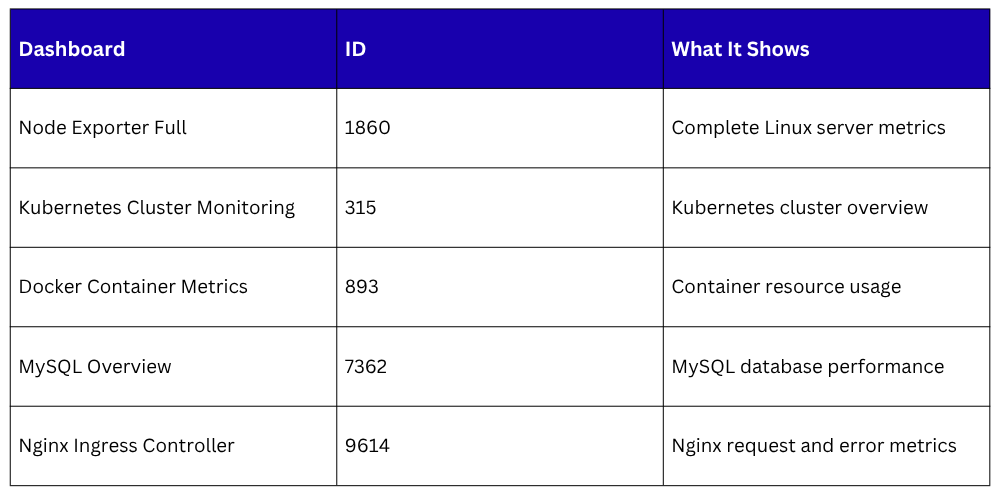 Importing a dashboard requires only the dashboard ID — Grafana downloads and applies it automatically, providing instant visibility into the target system without building panels from scratch.
Alerting with Prometheus and Grafana
Both Prometheus and Grafana support alerting, and they complement each other well.
Prometheus Alerting
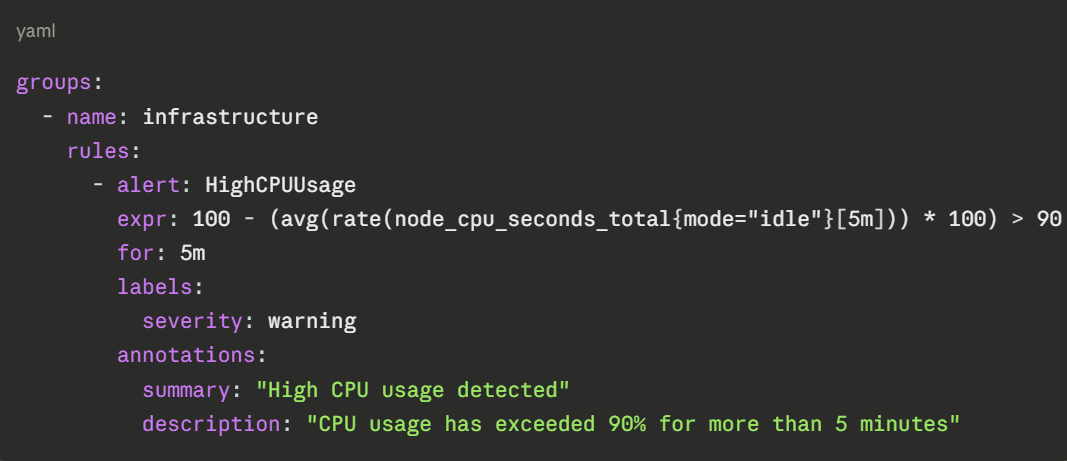
Alert rules are defined in Prometheus configuration files.
When a rule condition is met, such as CPU usage exceeding 90% for five minutes — Prometheus fires an alert and sends it to Alertmanager, which handles routing, deduplication, and delivery to notification channels like Slack, PagerDuty, or email.
A basic alert rule:
Grafana Alerting
Grafana also supports alert rules defined directly on dashboard panels, useful for alerting based on visualized data.
Grafana Alerting supports a wide range of notification channels and provides a unified interface for managing alert rules across multiple data sources.
Prometheus and Grafana in Kubernetes
In Kubernetes environments, Prometheus and Grafana are typically deployed using the kube-prometheus-stack Helm char.
A pre-configured bundle that installs Prometheus, Grafana, Alertmanager, Node Exporter, and a set of pre-built Kubernetes dashboards in a single command:

This immediately provides comprehensive visibility into the entire Kubernetes cluster — node resources, pod health, deployment status, and application metrics, with minimal configuration.

Class Sessions
Sales Campaign

We have a sales campaign on our promoted courses and products. You can purchase 1 products at a discounted price up to 15% discount.