Regression analysis is a fundamental statistical tool used extensively across various fields, including finance, economics, healthcare, and social sciences.
It provides a systematic way to examine the relationship between a dependent variable and one or more independent variables.
Through regression modeling, analysts can estimate how a change in one or more inputs influences an outcome, facilitate predictions, identify key drivers of trends, and inform strategic decisions.
Its versatility and effectiveness make it indispensable for trend identification, forecasting, risk assessment, and optimizing business processes.
Understanding Regression Analysis
Regression analysis revolves around fitting a mathematical model to observed data in order to describe the relationship between variables.
It helps answer questions such as “What is the expected outcome if we change the input?” and “How strongly are variables related?”
Types of Regression Analysis
1. Simple Linear Regression: Models the relationship between one independent variable and one dependent variable via a straight line.
Application: Estimating how advertising expenditure affects sales.
Equation: ![]()
![]()
2. Multiple Linear Regression: Extends simple linear regression by including multiple independent variables.
Application: Predicting property prices based on size, location, and number of bedrooms.
Equation: ![]()
![]()
3. Polynomial Regression: Fits a nonlinear relationship by adding polynomial terms.
Application: Modeling curvilinear trends such as population growth over time.
Equation: ![]()
4. Logistic Regression: Models binary outcome variables; estimates the probability of an event occurring.
Application: Predicting customer churn (yes/no).
Equation: Uses a logistic function, often called the logit.
5. Other Variants: Non-linear regression, decision tree regression, and ensemble methods like random forest are used for complex, non-linear, and high-dimensional relationships.
Trend Identification
Regression analysis is crucial for identifying and quantifying trends over time or across groups: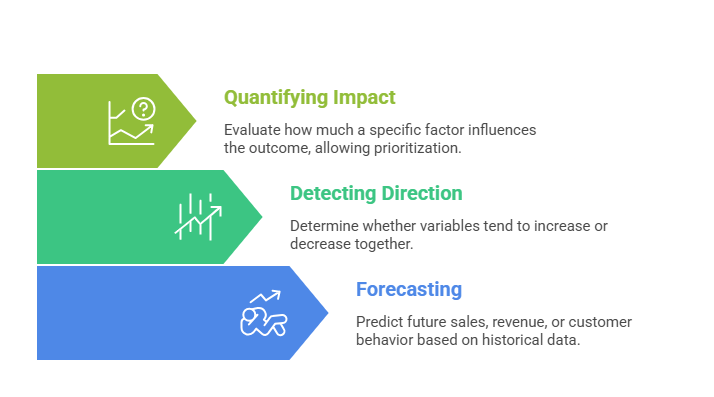
Key Metrics for Trend Analysis
1. Regression Coefficients (β): Indicate the magnitude and direction of relationships.
2. R-squared: Measures the proportion of variance explained by the model.
3. P-value: Tests the statistical significance of predictors.
4. Confidence Intervals: Provide a range within which the true effect likely falls.
Applications of Regression Analysis
Whether in business, finance, engineering, or healthcare, regression supports analytical accuracy and predictive power. The list ahead highlights where it is most frequently applied.
1. Forecasting and Planning: Sales, demand, and revenue forecasts by modeling past trends.
2. Risk Assessment: Credit scoring and financial risk modeling.
3. Performance Evaluation: Assessing the impact of marketing campaigns.
4. Operational Optimization: Inventory management and supply chain planning.
5. Predictive Maintenance: Estimating machine failure times based on operational data.
6. Medical Research: Determining factors influencing health outcomes.
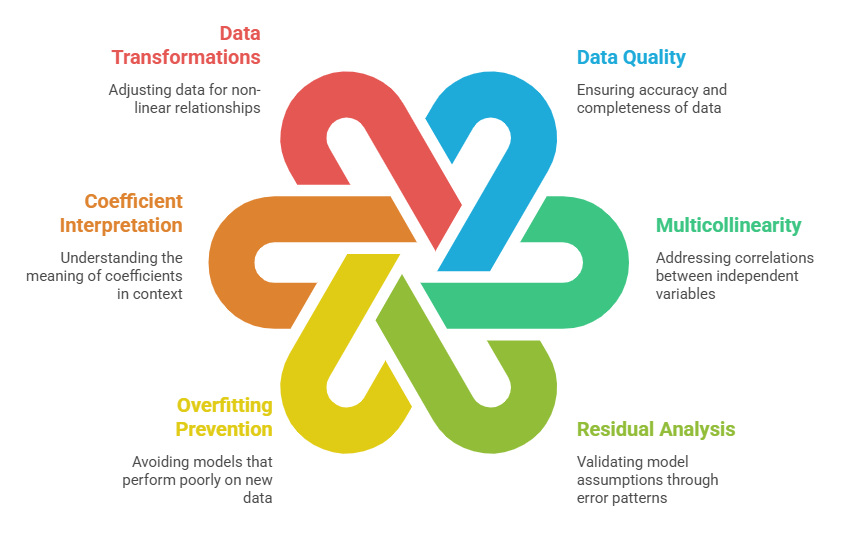
Best Practices in Regression Analysis
Regression analysis delivers value only when applied with rigor and awareness of its assumptions. Below are several recommended practices to enhance model performance.
Class Sessions
Sales Campaign

We have a sales campaign on our promoted courses and products. You can purchase 1 products at a discounted price up to 15% discount.