USD ($)
$
United States Dollar
Euro Member Countries
India Rupee

Correlation and Covariance Analysis

Lesson 15/51 | Study Time: 15 Min

Correlation and covariance are foundational statistical tools used to measure and analyze the relationship between two variables.

Understanding how two variables change in relation to each other allows analysts and researchers to determine whether variables move together, in opposite directions, or independently.

While both measure relationships, covariance indicates the direction but not the strength, whereas correlation quantifies both direction and strength and is standardized.

Proper application and interpretation of these measures enable informed decision-making, pattern recognition, and predictive modeling across diverse fields such as finance, economics, healthcare, and social sciences.

Covariance Analysis

Covariance measures how two variables vary together relative to their means. It calculates the average product of deviations of each variable from its respective average.


Interpretation:


1. Positive Covariance: Variables increase or decrease together.

2. Negative Covariance: One variable increases while the other decreases.

3. Zero Covariance: No linear relationship between variables.


Formula:      


Key Points:


1. Covariance values are unstandardized and depend on the units of the variables.

2. It provides directional insight but lacks a fixed range, making magnitude interpretation difficult.

3. Useful for understanding movement direction but less informative about strength.

Correlation Analysis

Correlation standardizes covariance by dividing it by the product of the standard deviations of the variables, resulting in a dimensionless value between -1 and +1.


Interpretation:


+1: Perfect positive linear correlation.

-1: Perfect negative linear correlation.

0: No linear correlation.


Formula (Pearson’s correlation coefficient):    


Advantages:


1. Scale-free and unitless, allowing comparison across datasets.

2. Measures both the strength and direction of the linear relationship.

3. Widely used in statistical modeling, hypothesis testing, and feature selection.

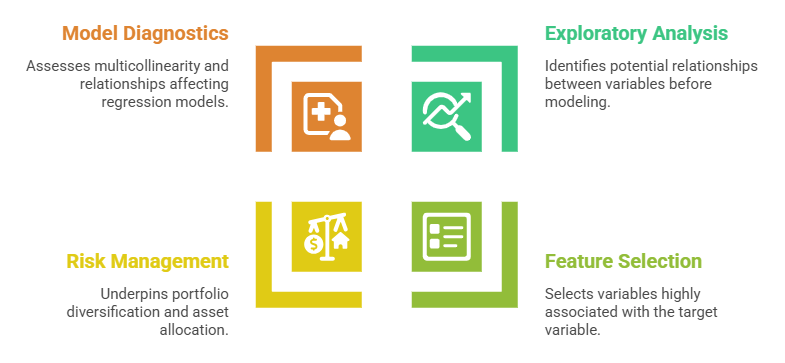
Applications in Data Analysis

In data analysis, correlation and covariance support smarter exploration and stronger modeling decisions. Below are common applications that demonstrate their importance.


Evan Brooks

Evan Brooks

Product Designer
Profile

Class Sessions

1- Understanding Data Analytics and Its Business Value 2- Evolution and Career Scope in Data Analytics 3- Types of Analytics: Descriptive, Diagnostic, Predictive, and Prescriptive 4- Data-Driven Decision-Making Frameworks 5- Business Analytics Integration and Strategic Alignment 6- Data Sources: Internal, External, Structured, and Unstructured 7- Data Collection Methods and Techniques 8- Identifying Data Quality Issues and Assessment Frameworks 9- Data Cleaning Fundamentals: Removing Duplicates, Handling Missing Values, Standardizing Formats 10- Correcting Inconsistencies and Managing Outliers 11- Data Validation and Quality Monitoring 12- Purpose and Importance of Exploratory Data Analysis 13- Summary Statistics: Mean, Median, Mode, Standard Deviation, Variance, Range 14- Measures of Distribution: Frequency Distribution, Percentiles, Quartiles, Skewness, Kurtosis 15- Correlation and Covariance Analysis 16- Data Visualization Techniques: Histograms, Box Plots, Scatter Plots, Heatmaps 17- Iterative Exploration and Hypothesis Testing 18- Regression Analysis and Trend Identification 19- Cluster Analysis and Segmentation 20- Factor Analysis and Dimension Reduction 21- Time-Series Analysis and Forecasting Fundamentals 22- Pattern Recognition and Anomaly Detection 23- Relationship Mapping Between Variables 24- Principles of Effective Data Visualization 25- Visualization Types and Their Applications 26- Creating Interactive and Dynamic Visualizations 27- Data Storytelling: Crafting Compelling Narratives 28- Narrative Structure: Problem, Analysis, Recommendation, Action 29- Visualization Best Practices: Color Theory, Labeling, and Clarity 30- Motion and Transitions for Enhanced Engagement 31- The Analytics Development Lifecycle (ADLC): Plan, Develop, Test, Deploy, Operate, Observe, Discover, Analyze 32- Planning Phase: Requirement Gathering and Stakeholder Alignment 33- Implementing Analytics Solutions: Tools, Platforms, and Technologies 34- Data Pipelines and Automated Workflows 35- Continuous Monitoring and Performance Evaluation 36- Feedback Mechanisms and Iterative Improvement 37- Stakeholder Identification and Audience Analysis 38- Tailoring Messages for Different Data Literacy Levels 39- Written Reports, Dashboards, and Interactive Visualizations 40- Presenting Insights to Executives, Technical Teams, and Operational Staff 41- Using Data to Support Business Decisions and Recommendations 42- Building Credibility and Trust Through Transparent Communication 43- Creating Actionable Insights and Clear Calls to Action 44- Core Principles of Data Ethics: Consent, Transparency, Fairness, Accountability, Privacy 45- The 5 C's of Data Ethics: Consent, Clarity, Consistency, Control, Consequence 46- Data Protection Regulations: GDPR, CCPA, and Compliance Requirements 47- Privacy and Security Best Practices 48- Bias Detection and Mitigation 49- Data Governance Frameworks and Metadata Management 50- Ethical Considerations in AI and Machine Learning Applications 51- Building a Culture of Responsible Data Use

Sales Campaign

Sales Campaign

We have a sales campaign on our promoted courses and products. You can purchase 1 products at a discounted price up to 15% discount.