Measures of distribution characterize the way data values are spread or arranged within a dataset.
Beyond understanding central tendency and dispersion, comprehending distribution shape is critical for revealing deeper data patterns that influence analysis and modeling.
Key measures of distribution include frequency distributions, percentiles, quartiles, skewness, and kurtosis.
These metrics provide insights into how data points are distributed, identify asymmetries and tail behaviors, and help analysts understand variability and data structure in an intuitive, actionable manner.
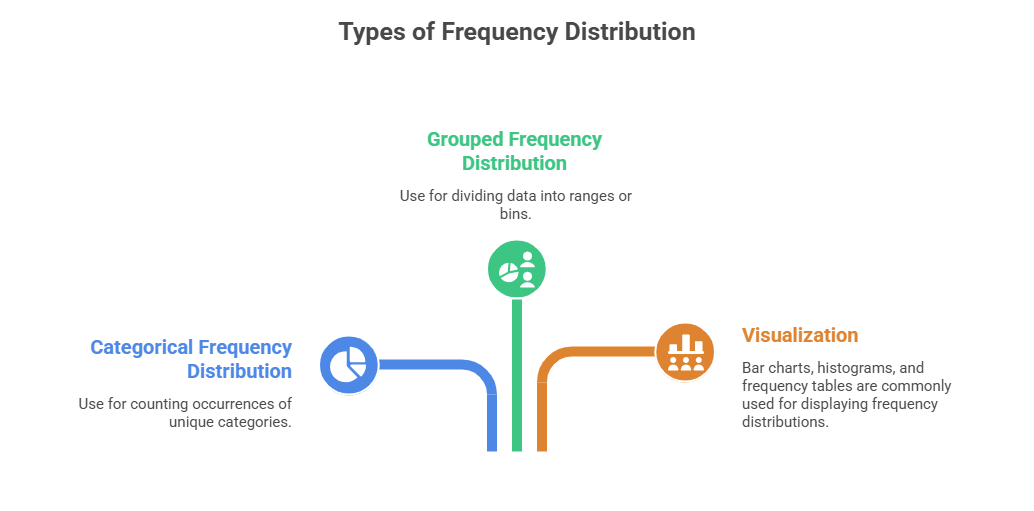
Frequency Distribution
Frequency distribution summarizes data by showing the number of observations occurring in each distinct category or interval.
Purpose: Provides an overview of how data values are populated or grouped, allowing identification of modes, gaps, or unusual clustering.
Percentiles
Percentiles divide a dataset into 100 equal parts, ranking data points based on their position in the ordered data.
Purpose: Indicate relative standing of a value within the dataset (e.g., the 90th percentile means the value exceeds 90% of the data).
Common Uses: Standardized test scores, income distribution analysis, performance benchmarking.
Calculation: Determined by sorting data and interpolating the position corresponding to the percentile rank.
Quartiles
Quartiles split the data into four equal parts or quarters, providing a simplified summary of the distribution spread.
Components:
Q1 (First Quartile): 25th percentile value.
Q2 (Second Quartile/Median): 50th percentile value.
Q3 (Third Quartile): 75th percentile value.
Interquartile Range (IQR): Difference between Q3 and Q1, measuring the middle 50% spread. IQR is a robust measure complementing variance and standard deviation.
Use: Detecting outliers and summarizing central dispersion.
Skewness
Skewness measures the asymmetry of the data distribution about its mean.
Interpretation:
1. Positive Skew (Right Skew): Longer or fatter tail on the right side. Indicates more low values with some extremely high values.
2. Negative Skew (Left Skew): Longer or fatter tail on the left side. Indicates higher values with some low outliers.
3. Zero Skew: Symmetrical data distribution.
Significance: Skewness affects the choice of statistical methods and signals potential data transformation needs.
Kurtosis
Kurtosis describes the "tailedness" or extremity of deviations in the data distribution.
.png)
Implications: Indicates risk of extreme events and affects statistical inference reliability.
Class Sessions
Sales Campaign

We have a sales campaign on our promoted courses and products. You can purchase 1 products at a discounted price up to 15% discount.