USD ($)
$
United States Dollar
Euro Member Countries
India Rupee

Purpose and Importance of Exploratory Data Analysis

Lesson 12/51 | Study Time: 15 Min

Exploratory Data Analysis (EDA) is a foundational step in the data analysis process, designed to help analysts understand the underlying structure and main characteristics of a dataset.

It involves using statistical and graphical techniques to uncover patterns, detect anomalies, and test assumptions without predetermined hypotheses.

It provides an open-ended, iterative approach that enables data scientists and stakeholders to grasp the data’s complexities, validate its quality, and prepare it for more sophisticated modeling or decision-making.

This stage ensures that subsequent analyses are based on reliable, well-understood data, ultimately leading to accurate and actionable insights.

Purpose of Exploratory Data Analysis

The purpose of EDA encompasses several key objectives necessary for robust data understanding and analysis readiness:


1. Data Familiarization: Gain a deep understanding of the dataset’s features, including the types of variables, distributions, and range of values.

2. Detecting Data Quality Issues: Identify missing values, outliers, and errors that might compromise analysis results.

3. Uncovering Patterns and Relationships: Visualize and analyze relationships between variables, including correlations, clusters, or trends that can inform hypotheses.

4. Validating Assumptions: Check if the data meet the assumptions required for applying specific statistical methods or models.

5. Hypothesis Generation: Formulate new questions or potential explanations based on observed data patterns.

6. Guiding Modeling Decisions: Inform the choice of appropriate modeling techniques and feature engineering based on data characteristics.

Importance of Exploratory Data Analysis

EDA’s significance extends beyond preliminary investigation; it fundamentally shapes the quality and credibility of data-driven outcomes.

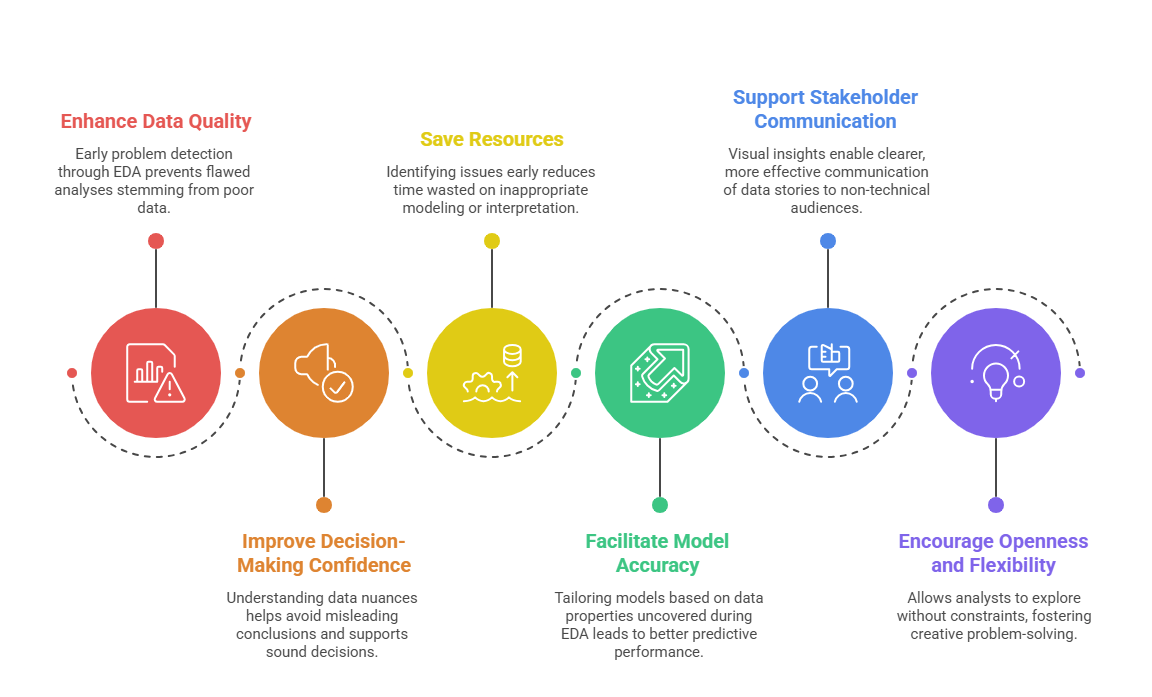
Common EDA Techniques and Tools

EDA utilizes a variety of descriptive statistics and visualization tools, including:


1. Univariate Analysis: Analysis of individual variables using histograms, box plots, and summary statistics to understand distribution and central tendency.

2. Bivariate and Multivariate Analysis: Exploring relationships with scatter plots, correlation matrices, cross-tabulations, and pair plots.

3. Outlier Detection: Identifying extreme values and anomalies through box plots and statistical tests.

4. Missing Value Analysis: Quantifying and visualizing gaps in data.


Popular tools to perform EDA include Python (Pandas, Matplotlib, Seaborn), R (ggplot2, dplyr), Tableau, and Power BI.

Evan Brooks

Evan Brooks

Product Designer
Profile

Class Sessions

1- Understanding Data Analytics and Its Business Value 2- Evolution and Career Scope in Data Analytics 3- Types of Analytics: Descriptive, Diagnostic, Predictive, and Prescriptive 4- Data-Driven Decision-Making Frameworks 5- Business Analytics Integration and Strategic Alignment 6- Data Sources: Internal, External, Structured, and Unstructured 7- Data Collection Methods and Techniques 8- Identifying Data Quality Issues and Assessment Frameworks 9- Data Cleaning Fundamentals: Removing Duplicates, Handling Missing Values, Standardizing Formats 10- Correcting Inconsistencies and Managing Outliers 11- Data Validation and Quality Monitoring 12- Purpose and Importance of Exploratory Data Analysis 13- Summary Statistics: Mean, Median, Mode, Standard Deviation, Variance, Range 14- Measures of Distribution: Frequency Distribution, Percentiles, Quartiles, Skewness, Kurtosis 15- Correlation and Covariance Analysis 16- Data Visualization Techniques: Histograms, Box Plots, Scatter Plots, Heatmaps 17- Iterative Exploration and Hypothesis Testing 18- Regression Analysis and Trend Identification 19- Cluster Analysis and Segmentation 20- Factor Analysis and Dimension Reduction 21- Time-Series Analysis and Forecasting Fundamentals 22- Pattern Recognition and Anomaly Detection 23- Relationship Mapping Between Variables 24- Principles of Effective Data Visualization 25- Visualization Types and Their Applications 26- Creating Interactive and Dynamic Visualizations 27- Data Storytelling: Crafting Compelling Narratives 28- Narrative Structure: Problem, Analysis, Recommendation, Action 29- Visualization Best Practices: Color Theory, Labeling, and Clarity 30- Motion and Transitions for Enhanced Engagement 31- The Analytics Development Lifecycle (ADLC): Plan, Develop, Test, Deploy, Operate, Observe, Discover, Analyze 32- Planning Phase: Requirement Gathering and Stakeholder Alignment 33- Implementing Analytics Solutions: Tools, Platforms, and Technologies 34- Data Pipelines and Automated Workflows 35- Continuous Monitoring and Performance Evaluation 36- Feedback Mechanisms and Iterative Improvement 37- Stakeholder Identification and Audience Analysis 38- Tailoring Messages for Different Data Literacy Levels 39- Written Reports, Dashboards, and Interactive Visualizations 40- Presenting Insights to Executives, Technical Teams, and Operational Staff 41- Using Data to Support Business Decisions and Recommendations 42- Building Credibility and Trust Through Transparent Communication 43- Creating Actionable Insights and Clear Calls to Action 44- Core Principles of Data Ethics: Consent, Transparency, Fairness, Accountability, Privacy 45- The 5 C's of Data Ethics: Consent, Clarity, Consistency, Control, Consequence 46- Data Protection Regulations: GDPR, CCPA, and Compliance Requirements 47- Privacy and Security Best Practices 48- Bias Detection and Mitigation 49- Data Governance Frameworks and Metadata Management 50- Ethical Considerations in AI and Machine Learning Applications 51- Building a Culture of Responsible Data Use

Sales Campaign

Sales Campaign

We have a sales campaign on our promoted courses and products. You can purchase 1 products at a discounted price up to 15% discount.