In any dataset, inconsistencies and outliers can significantly impact the accuracy and reliability of the analysis.
Data inconsistencies arise from conflicting, duplicated, or erroneous values within datasets, which can cause confusion and distort results.
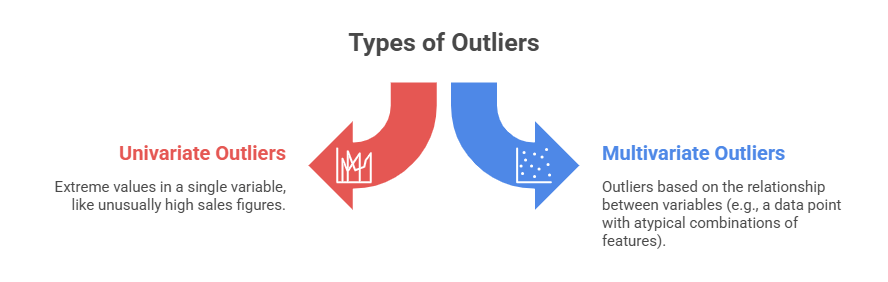
Outliers are data points that deviate markedly from other observations, often indicating variability, errors, or novel phenomena.
Correcting inconsistencies and properly managing outliers are vital components of data cleaning and preprocessing.
These steps enhance data quality and ensure that subsequent analytics provide valid, trustworthy insights to support confident decision-making.
Understanding Data Inconsistencies
Data inconsistencies occur when the same data element contains different values or formats across records or systems. This can be caused by manual entry errors, system integration issues, or outdated information.
Common Types of Inconsistencies:
1. Format Discrepancies: Variations in date formats, units (e.g., kg vs. lbs), or naming conventions ("NYC" vs. "New York").
2. Conflicting Values: Different records indicating contradictory information for the same entity.
3. Duplications and Redundancies: Multiple versions of the same data point recorded differently.
4. Data Drift: Gradual changes over time leading to mismatches or misalignment with original data standards.
Correcting Inconsistencies:
1. Standardisation: Harmonise formats and units throughout the dataset.
2. Data Reconciliation: Cross-verify and consolidate conflicting values using business rules or authoritative sources.
3. Deduplication: Remove or consolidate duplicate records.
4. Validation Checks: Implement consistency rules to identify and correct anomalies during data entry and processing.
Managing Outliers
Outliers are extreme data points that deviate significantly from other observations in the dataset. They may indicate genuine variability or errors and can disproportionately affect statistical measures and models.
Causes of Outliers: Data entry or measurement errors, sampling errors or noise, and natural variability or rare events
Strategies for Handling Outliers:
1. Identification
Visual Methods: Box plots, scatter plots, histograms.
Statistical Methods: Z-score, IQR (Interquartile Range), Mahalanobis distance.
2. Treatment Options:
Verification: Confirm if outliers are errors or valid extreme values.
Transformation: Apply log, square root, or other transformations to reduce skewness.
Imputation or Replacement: Replace outliers with mean, median or predicted values.
Exclusion: Remove outliers if they’re errors or irrelevant to the analysis.
Segmentation: Analyze outliers separately if they represent a meaningful subgroup.
Considerations:
1. Outlier treatment depends on the context and the objectives of the analysis.
2. Removing valuable rare events can bias results.
3. Modelling approaches may be chosen based on robustness to outliers.