Code quality and debugging are essential practices for developing reliable and maintainable JavaScript applications.
Tools like ESLint help identify potential errors and enforce consistent coding standards, while Prettier automatically formats code to keep it clean and readable.
Debugging tools such as browser console utilities and breakpoints allow developers to inspect code execution, track variable values, and locate issues efficiently.
Code Quality: Why It Matters in Web Development
Clean code isn't just aesthetic—it's the foundation of scalable web apps.
Setting Up ESLint for Error Prevention
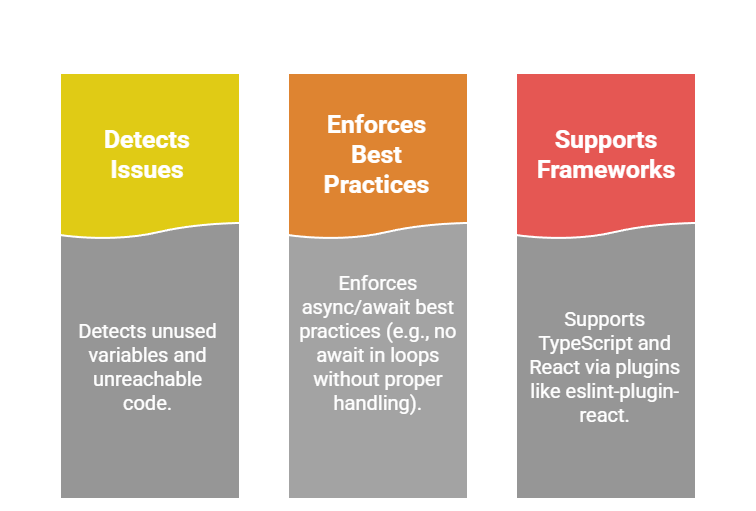
ESLint is an open-source tool that analyzes your code for potential errors, stylistic issues, and anti-patterns, following standards like Airbnb or Google style guides.
It runs as a configurable plugin in your editor or build process, catching problems before they reach the browser.
Start by installing ESLint via npm in your project:
1. Run npm: init -y to create a package.json.
2. Install ESLint: npm install eslint --save-dev.
3. Initialize: npx eslint --init (choose JavaScript modules, browser environment, and a config like "Standard").
Configure a .eslintrc.json file for common rules
{

  "env": { "browser": true, "es2022": true },

  "extends": ["eslint:recommended"],

  "rules": {

    "no-unused-vars": "warn",

    "semi": ["error", "always"]

  }

}
Run it with npx eslint yourfile.js or integrate via VS Code extension for real-time feedback. For example, ESLint flags console.log(undefinedVariable) as an error, preventing runtime crashes.
Key Benefits
In a real project, like a JavaScript todo app, ESLint might warn against mutable state mutations: todos.push(newItem) → suggest const newTodos = [...todos, newItem].
Prettier: Automated Code Formatting
Prettier is an opinionated code formatter that auto-arranges your code for readability, eliminating debates over semicolons or quotes.
It pairs perfectly with ESLint, handling style while ESLint focuses on logic—use ESLint's prettier plugin to avoid conflicts.
Install and Setup
1. npm install: prettier eslint-config-prettier eslint-plugin-prettier --save-dev.
2. Add to .eslintrc.json: "extends": ["prettier"].
3. Create .prettierrc:
{

  "semi": true,

  "trailingComma": "es5",

  "singleQuote": true,

  "printWidth": 80

}
Format files with npx prettier --write . or VS Code's "Format on Save." Before: messy multi-line functions become neatly indented, like transforming a jumbled fetch call into:
fetch('/api/data')

  .then(response => response.json())

  .then(data => console.log(data))

  .catch(error => console.error(error));
Debugging: Fixing Issues Before They Break Your App
Bugs are inevitable, but modern browser tools turn debugging from guesswork into precision work.
Mastering Console Tools in DevTools
Every browser's DevTools (F12 or right-click > Inspect) offers a Console tab for real-time JavaScript interaction—your first line of defense.
It supports logging, assertions, and object inspection, with features like console.table() added in recent Chrome/Edge updates.
Common Methods
1. console.log('Value:', myVar): Basic output.
2. console.error('Failed!'): Red-highlighted errors.
3. console.table(arrayOfObjects): Tabular data view—ideal for debugging arrays.
For a fetch API issue in your course project:
fetch('/todos')

  .then(res => {

    console.log('Status:', res.status);  // Logs 404 if endpoint missing

    return res.json();

  })

  .then(data => console.table(data))     // Pretty table of todos

  .catch(err => console.error('Fetch error:', err));
Advanced tips
1. Console.assert(condition, 'message'): Halts if false, e.g., console.assert(user.age > 0, 'Invalid age').
2. Performance tab: Profile slow functions with console.time('fetch') / console.timeEnd('fetch').
3. Group logs: console.group('API Calls') for collapsible sections.
These tools reveal issues like undefined props in event handlers without redeploying.
Using Breakpoints for Step-by-Step Troubleshooting
Breakpoints pause execution at specific lines, letting you inspect variables mid-run—far superior to console.logs for complex flows.
Chrome DevTools (Sources tab) supports line, conditional, and DOM breakpoints.
Setup Process
1. Open DevTools > Sources > your JS file.
2. Click line number to set a breakpoint (blue marker appears).
3. Reload page; execution pauses—hover variables or use Scope panel.
For a loop bug in a JavaScript counter app
for (let i = 0; i < items.length; i++) {

  // Breakpoint here: Inspect 'i' and 'items[i]'

  total += items[i].price;

}
Types of Breakpoints
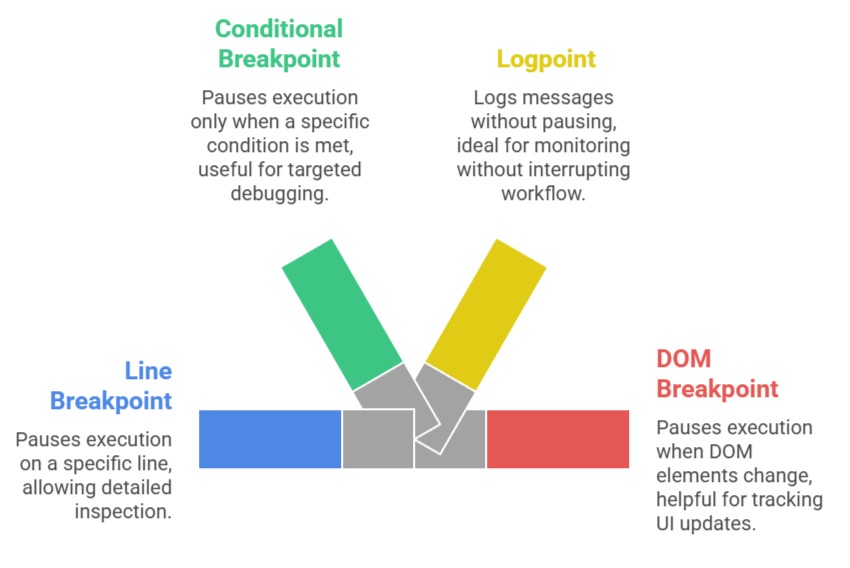
Pro Tip: Use "Blackbox" script (right-click in Sources) to skip libraries like React, focusing on your code.

Class Sessions
Sales Campaign

We have a sales campaign on our promoted courses and products. You can purchase 1 products at a discounted price up to 15% discount.