Pandas
Pandas is a powerful open-source Python library designed for efficient data manipulation, analysis, and management. It provides flexible and high-performance data structures that make working with structured data, such as tables, time series, and heterogeneous datasets, simple and intuitive. At its core, Pandas offers two primary data structures: the Series, which is a one-dimensional labeled array capable of holding any data type with an associated index for easy data selection and alignment, and the DataFrame, which is a two-dimensional labeled table similar to a spreadsheet or SQL table, where each column can hold different data types and rows and columns are labeled for fast indexing and manipulation. Pandas also includes powerful tools for handling missing data, allowing users to detect, replace, or drop null values efficiently, ensuring clean and reliable datasets for analysis. Its capabilities extend to reading and writing data from multiple sources, including CSV, Excel, SQL databases, JSON, and HTML, and performing complex operations like filtering, grouping, merging, reshaping, pivoting, and aggregating data. With robust support for time series data, Pandas enables resampling, frequency conversion, moving window statistics, and date-time indexing, making it ideal for financial analysis, forecasting, and trend detection. Built on top of NumPy, Pandas leverages vectorized operations and optimized memory structures, providing high performance and efficiency for large datasets. Furthermore, it integrates seamlessly with visualization libraries like Matplotlib and Seaborn, numerical libraries like NumPy, and machine learning frameworks such as Scikit-learn and TensorFlow. Because of these capabilities, Pandas has become an essential tool in data science, enabling analysts and developers to clean, explore, preprocess, and analyze data effectively while preparing it for further computational or predictive modeling tasks.
Importance of Pandas in Data Analysis
Pandas is one of the most essential Python libraries for data analysis, providing powerful tools to handle, manipulate, and analyze structured data efficiently. Its importance lies in enabling analysts and data scientists to work with large and complex datasets with ease, transforming raw data into meaningful insights for decision-making. Pandas serves as the foundation for many data analysis workflows in Python due to its flexibility, performance, and integration with other analytical libraries.
1. Efficient Data Structures
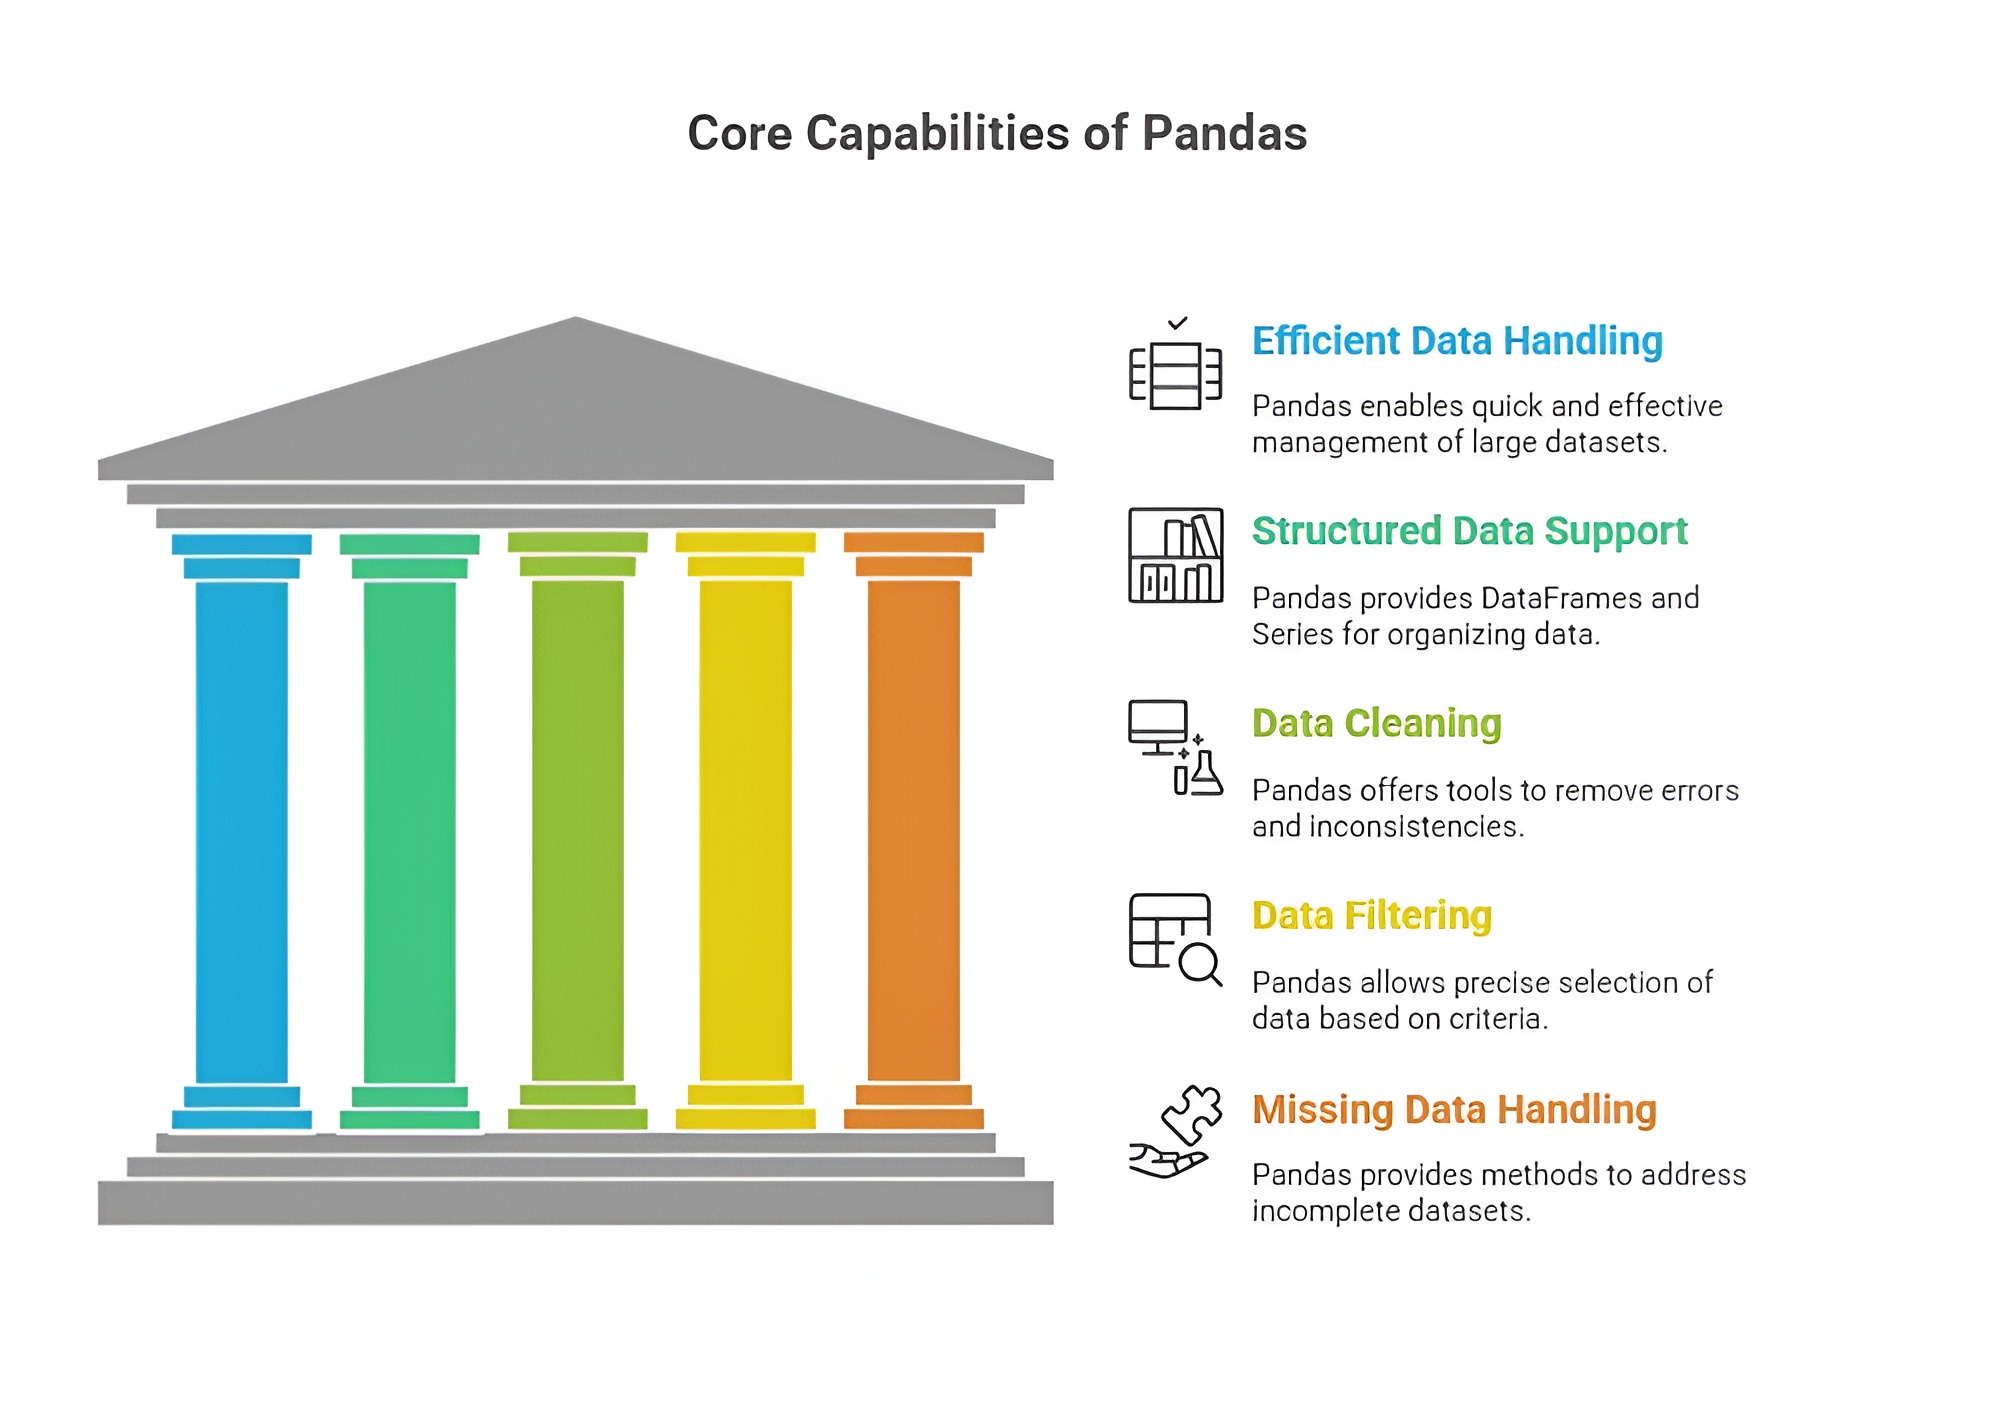
Pandas provides highly efficient and intuitive data structures, namely DataFrames and Series, which allow users to store tabular data in a structured format. DataFrames support row and column indexing, heterogeneous data types, and labeled axes, enabling analysts to manipulate and access data conveniently. These structures are designed to handle large datasets efficiently, making it easier to perform complex operations without writing extensive code.
2. Data Cleaning and Preprocessing
Pandas is crucial for data cleaning, which is a fundamental step in data analysis. It offers functions to detect missing values, remove duplicates, replace or fill null entries, and transform data types. These capabilities allow analysts to prepare datasets accurately and efficiently, ensuring that the data used for analysis or modeling is reliable and error-free. Proper data cleaning with Pandas reduces the risk of misleading results and enhances the quality of insights derived from the data.
3. Data Manipulation and Transformation
Pandas allows for comprehensive data manipulation, including filtering, grouping, merging, concatenating, pivoting, reshaping, and aggregating datasets. This makes it possible to organize data according to analytical needs, extract relevant subsets, and summarize complex datasets in meaningful ways. The library simplifies these tasks, which would otherwise require extensive programming effort, enabling analysts to focus on interpretation and insight generation.
4. Integration with Other Libraries
Pandas integrates seamlessly with other Python libraries used in data analysis, such as NumPy for numerical computation, Matplotlib and Seaborn for visualization, and Scikit-learn for machine learning. This integration allows analysts to perform end-to-end data workflows within a single environment, from preprocessing and transformation to visualization and modeling. Such compatibility makes Pandas a cornerstone in Python’s data analysis ecosystem.
5. Handling Large and Complex Datasets
Pandas is designed to handle large datasets efficiently, supporting operations on millions of rows without significant performance degradation. Its indexing, vectorized operations, and optimized data access methods enable fast computation and analysis. This capability is essential in modern data-driven applications, where datasets are often extensive and complex, requiring robust tools to manage them effectively.
6. Time Series and Statistical Analysis
Pandas provides built-in support for time series data, allowing analysts to perform resampling, rolling window calculations, shifting, and date-time manipulations. It also facilitates statistical operations, such as calculating mean, median, standard deviation, correlation, and cumulative statistics. These features make Pandas highly suitable for financial analysis, business forecasting, and research involving sequential or temporal data.
7. Ease of Data Export and Import
Pandas supports reading and writing data from multiple formats, including CSV, Excel, SQL databases, JSON, and HDF5. This allows analysts to integrate data from various sources and export results in formats compatible with other tools, enhancing collaboration and workflow efficiency. Easy data import and export make Pandas a practical tool for real-world applications across business, research, and technology domains.
Pandas is indispensable in data analysis because it provides efficient data structures, robust cleaning and transformation tools, seamless integration with analytical libraries, support for large and complex datasets, time series functionality, and versatile data import/export capabilities. Its combination of performance, flexibility, and ease of use makes it a core library for Python-based data analysis, enabling professionals to derive meaningful insights, make informed decisions, and implement data-driven solutions efficiently.
Uses of Pandas in Data Analysis
Pandas is widely used in Python data analysis workflows due to its powerful data manipulation and analysis capabilities. It allows analysts, data scientists, and researchers to efficiently process datasets, gain insights, and prepare data for visualization and modeling. The following points explain the main uses of Pandas in detail.
1. Data Cleaning and Preprocessing
Pandas is extensively used to clean and preprocess raw data. Analysts can handle missing values, remove duplicates, standardize formats, and filter data efficiently. These preprocessing operations are essential for ensuring that data used in analysis or modeling is accurate, consistent, and reliable. Proper cleaning and preprocessing reduce errors and improve the quality of insights derived from the data.
2. Data Transformation and Manipulation
Pandas provides versatile tools to transform and manipulate datasets, including merging, concatenating, pivoting, reshaping, and aggregating data. It allows users to organize data according to analytical needs, extract specific subsets, and summarize complex datasets. This makes it easier for analysts to prepare data for visualization, statistical analysis, or machine learning models without writing extensive code.
3. Exploratory Data Analysis (EDA)
Pandas is heavily used in EDA to understand the structure, patterns, and key characteristics of a dataset. It enables the calculation of summary statistics, correlations, frequency counts, and distributions, which help in identifying trends, anomalies, and relationships within the data. By facilitating EDA, Pandas allows analysts to make data-driven hypotheses and informed decisions.
4. Handling Large Datasets
Pandas is capable of processing large datasets efficiently, making it suitable for real-world applications in business, research, and technology. Its optimized indexing and vectorized operations allow analysts to perform complex calculations on millions of rows without significant performance issues. This scalability ensures that Pandas can support both small-scale and enterprise-level data analysis projects.
5. Time Series Analysis
Pandas provides specialized functionality for time series data, including date-time indexing, resampling, rolling window calculations, and shift operations. This makes it ideal for applications like financial analysis, sales forecasting, and trend monitoring, where sequential data must be analyzed and interpreted. Time series support enables analysts to extract meaningful patterns and insights from temporal datasets.
6. Integration with Visualization and Machine Learning Libraries
Pandas integrates seamlessly with Python libraries such as Matplotlib, Seaborn, and Plotly for visualization, as well as Scikit-learn, TensorFlow, and PyTorch for machine learning. Analysts can easily convert Pandas DataFrames into inputs for models, generate visual representations, and perform predictive analysis. This integration supports end-to-end data analysis workflows in a single Python environment.
7. Data Export and Reporting
Pandas supports exporting data to multiple formats including CSV, Excel, JSON, SQL databases, and HDF5. This functionality allows analysts to share processed datasets, generate reports, and integrate results into other business tools. Efficient export capabilities make Pandas a practical choice for collaborative projects, reporting dashboards, and automated data pipelines.
8. Statistical and Mathematical Operations
Pandas allows users to perform statistical calculations such as mean, median, standard deviation, correlation, cumulative sums, and rolling averages directly on DataFrames and Series. These operations are essential for data exploration, hypothesis testing, and modeling, enabling analysts to derive actionable insights from datasets efficiently.
Pandas is indispensable in Python data analysis because it streamlines data cleaning, transformation, exploration, time series analysis, integration with other tools, export, and statistical operations. Its powerful, flexible, and easy-to-use features make it a core library for professionals working on real-world data, allowing them to analyze, interpret, and present data effectively.
Need of Pandas in Data Analysis
NumPy is an essential library for Python-based data analysis and computational tasks due to its efficiency, versatility, and scalability. The need for NumPy arises from the increasing volume, complexity, and speed of data in modern business, research, and technology applications. It provides the tools required to handle numerical computations, multidimensional datasets, and integration with advanced analytics platforms.
1. Handling Complex and Large Datasets
Real-world datasets are often complex and voluminous, containing millions of rows and heterogeneous data types. Pandas is needed to manage, manipulate, and process large datasets efficiently without requiring extensive programming. Its optimized DataFrame and Series structures allow analysts to perform operations like filtering, aggregation, and reshaping rapidly, which is crucial for timely decision-making.
2. Simplifying Data Cleaning and Preprocessing
Raw data typically contains missing values, inconsistencies, duplicates, and errors, which must be corrected before analysis. Pandas is needed to clean and preprocess data effectively, offering built-in functions for handling null values, standardizing formats, removing duplicates, and transforming data types. This ensures that subsequent analysis or modeling is accurate, reliable, and meaningful.
3. Efficient Data Transformation and Manipulation
Data often needs to be reshaped, aggregated, merged, or filtered to extract relevant insights. Pandas provides versatile tools to perform these operations quickly and intuitively, reducing manual effort and coding complexity. Its functionality allows analysts to focus on understanding data patterns and deriving insights rather than on tedious data manipulation tasks.
4. Enabling Exploratory Data Analysis (EDA)
Pandas is needed to perform exploratory data analysis, which helps in understanding data structure, identifying trends, detecting anomalies, and generating hypotheses. Summary statistics, groupings, and correlation calculations can be performed directly in Pandas, providing a solid foundation for further modeling or visualization.
5. Seamless Integration with Other Libraries
Modern data analysis workflows require integration between data manipulation, visualization, and machine learning tools. Pandas is needed to bridge these workflows, integrating effortlessly with NumPy for computations, Matplotlib and Seaborn for visualizations, and Scikit-learn, TensorFlow, or PyTorch for modeling. This integration enables end-to-end data analysis in a single, unified Python environment.
6. Time Series and Advanced Analytics Support
Many real-world applications involve time-dependent or sequential data, such as financial markets, sensor readings, or web traffic. Pandas is needed to analyze, resample, and manipulate time series efficiently, making it indispensable for forecasting, trend analysis, and anomaly detection. Its built-in support for rolling windows, shifting, and datetime indexing simplifies complex temporal calculations.
7. Data Export, Reporting, and Collaboration
Processed data often needs to be exported, shared, or integrated with other systems. Pandas is needed to read from and write to multiple file formats like CSV, Excel, JSON, and SQL, facilitating reporting and collaboration. Its functionality ensures that teams can work together effectively and maintain consistency and reproducibility in data-driven projects.
Pandas is fundamentally needed in Python data analysis because it streamlines data handling, cleaning, transformation, exploration, and integration with other tools, while also supporting large datasets, time series, and collaborative workflows. Its comprehensive capabilities save time, reduce errors, and enable analysts and data scientists to extract actionable insights efficiently, making it a core requirement for modern data analysis.
Series and DataFrame Structures in Panda
1) Series
A Series is a one-dimensional labeled array in Pandas, capable of holding data of any type, including integers, floats, strings, or even Python objects. Each element in a Series has an index, which acts as a label for easy access, retrieval, and alignment of data. Unlike a standard NumPy array, a Series can store heterogeneous types of data with meaningful labels, making it more suitable for real-world datasets where indexing and labeling are important.
Series are highly flexible and support vectorized operations, just like NumPy arrays. They can be created from Python lists, dictionaries, or NumPy arrays. The index provides an efficient way to align data from different sources, perform conditional selection, and handle time-series data effectively.
Example:
import pandas as pd
# Creating a Series with a custom index
data = pd.Series([10, 20, 30, 40], index=['a', 'b', 'c', 'd'])
print(data)
Output:
a 10
b 20
c 30
d 40
dtype: int64
In this example, each value has a corresponding label, which can be used to access or manipulate specific elements efficiently. Series are particularly useful when tracking measurements, stock prices, sensor readings, or any sequential data.
2) DataFrame
A DataFrame is a two-dimensional labeled data structure in Pandas, similar to a table in a database or an Excel spreadsheet. Each column in a DataFrame can hold different data types, such as integers, floats, strings, or even Python objects. Rows and columns are both labeled, with row indices and column names providing powerful data alignment and selection capabilities.
DataFrames are the most commonly used Pandas data structure because they provide intuitive operations for filtering, aggregation, reshaping, and merging datasets. They are ideal for handling structured datasets from CSV files, Excel sheets, SQL databases, and JSON data, enabling efficient exploration and preprocessing of real-world data.
Example:
# Creating a DataFrame from a dictionary
data = {
'Name': ['Alice', 'Bob', 'Charlie'],
'Age': [25, 30, 35],
'City': ['New York', 'Los Angeles', 'Chicago']
}
df = pd.DataFrame(data)
print(df)
Output:
Name Age City
0 Alice 25 New York
1 Bob 30 Los Angeles
2 Charlie 35 Chicago
In this example, the DataFrame stores heterogeneous data across multiple columns. The row indices (0, 1, 2) and column names (Name, Age, City) make it easy to access, filter, and manipulate specific parts of the dataset.
Creating, Reading, and Writing DataFrames in Pandas
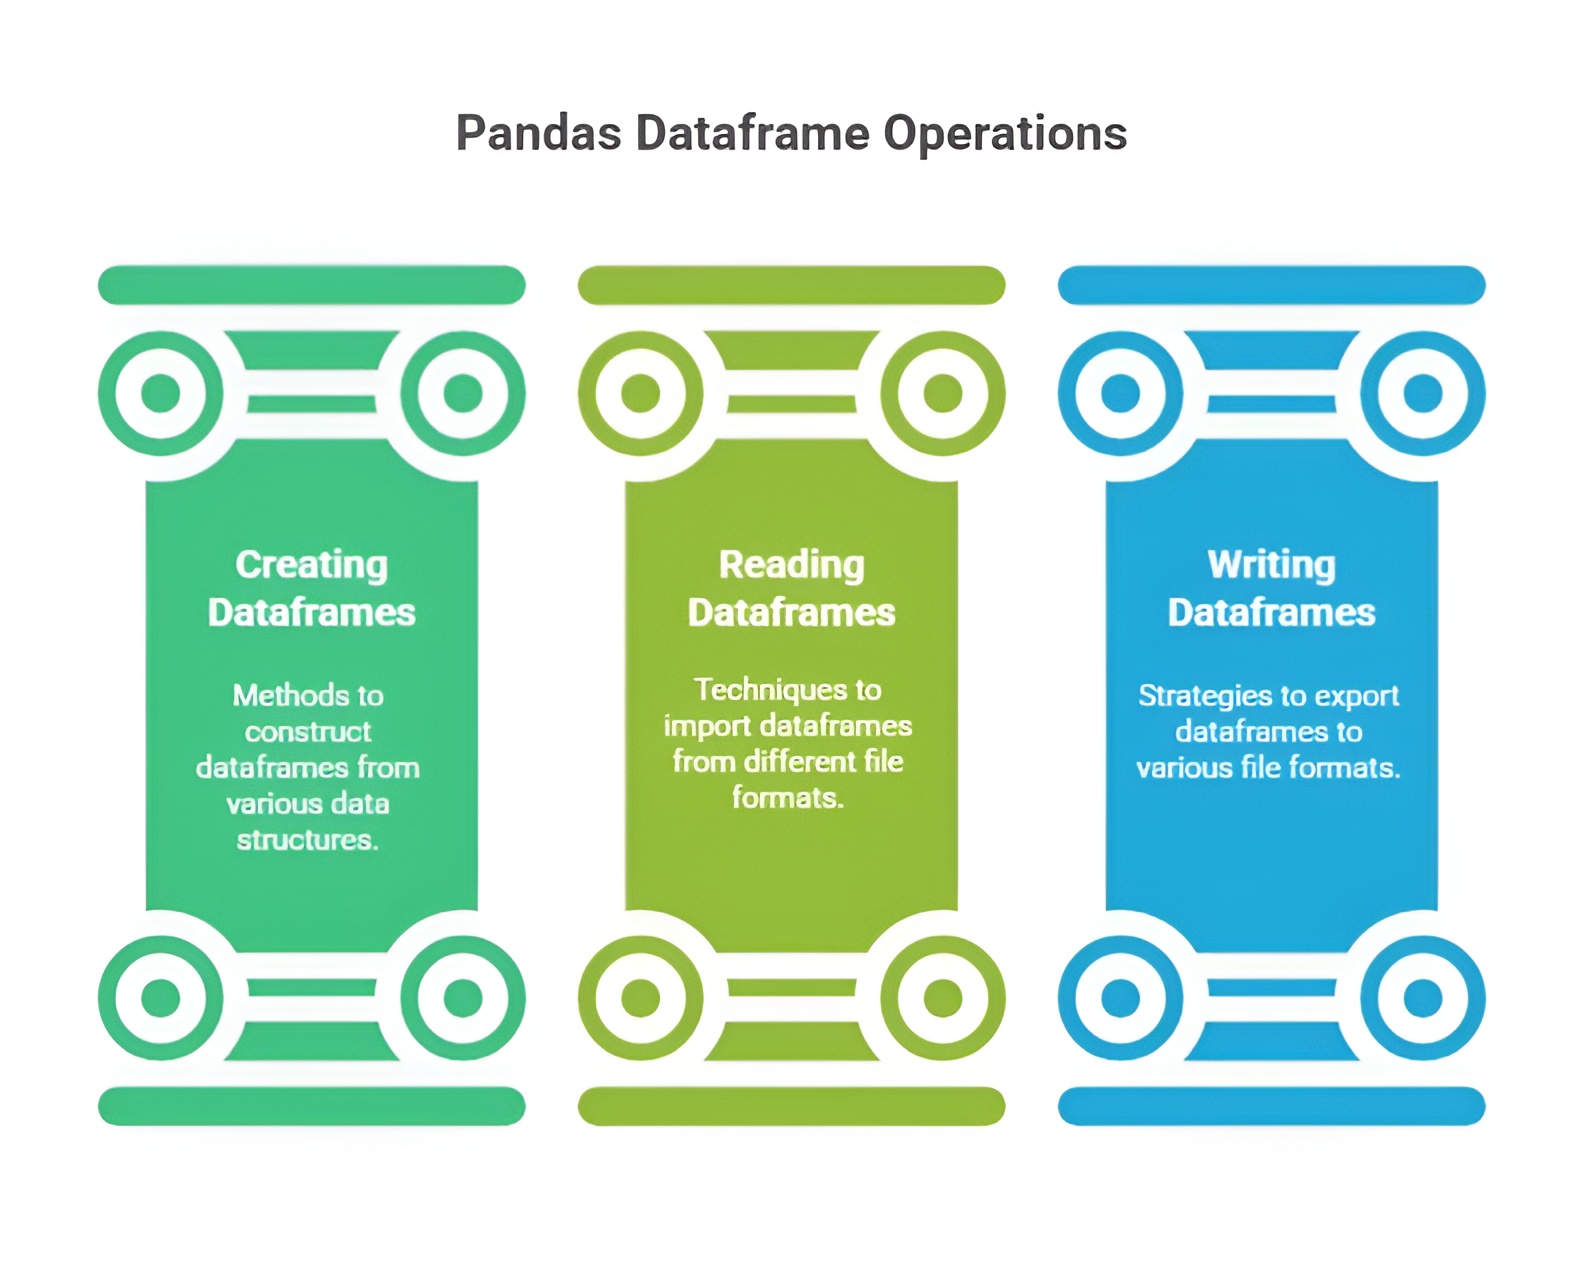
Creating, reading, and writing DataFrames in Pandas involves working with structured data using simple and powerful functions. You can create DataFrames manually or load them from external sources like CSV, Excel, or SQL files. Pandas also allows exporting processed DataFrames back into various formats for storage or sharing. Overall, these features make it easy to manage and move data throughout the analysis process.
1) Creating DataFrames
DataFrames are two-dimensional, labeled data structures in Pandas, similar to a table in a relational database or an Excel spreadsheet. They allow you to store heterogeneous data types in a single structure: each column can have its own data type (integer, float, string, or boolean). Unlike NumPy arrays, which require homogeneous types, DataFrames are designed to handle real-world, messy datasets efficiently.
DataFrames are highly flexible, allowing creation from Python dictionaries, lists, NumPy arrays, or even other DataFrames. Each method provides a slightly different approach for organizing and labeling data:
1.1 From a dictionary:
1.2 From a list of dictionaries:
1.3 From NumPy arrays:
A DataFrame can be created from a 2D NumPy array. Column names can be supplied separately. This approach combines the speed and efficiency of NumPy arrays with Pandas’ labeling and indexing capabilities.
Example:
import pandas as pd
import numpy as np
# From dictionary
data_dict = {'Name': ['Alice', 'Bob', 'Charlie'], 'Age': [25, 30, 35]}
df_dict = pd.DataFrame(data_dict)
# From list of dictionaries
data_list = [{'Name': 'Alice', 'Age': 25}, {'Name': 'Bob', 'Age': 30}, {'Name': 'Charlie'}]
df_list = pd.DataFrame(data_list)
# From NumPy array
array_data = np.array([[1, 2], [3, 4], [5, 6]])
df_array = pd.DataFrame(array_data, columns=['A', 'B'])
This demonstrates the flexibility of DataFrame creation, handling structured, incomplete, or numerical datasets seamlessly.
2) Reading DataFrames from External Sources
Reading DataFrames from external sources in Pandas involves importing structured data from files like CSV, Excel, JSON, and SQL databases into a DataFrame. Pandas provides simple functions such as read_csv(), read_excel(), and read_sql() to load data efficiently. These functions automatically handle headers, data types, and formatting. They also offer options to customize how data is parsed or cleaned during import. Overall, this capability makes Pandas highly flexible for working with real-world datasets from multiple sources.
2.1 CSV files: CSV is the most common tabular data format. pd.read_csv() reads CSV files into a DataFrame, automatically handling separators, headers, and missing values.
2.2 Excel files: Excel is widely used in business and research. pd.read_excel() allows reading from a specific sheet, making it easy to work with spreadsheets containing multiple datasets.
2.3 JSON files: JSON is often used in web applications and APIs. pd.read_json() converts JSON objects into DataFrames. Pandas can parse nested JSON structures with the json_normalize function.
Example:
df_csv = pd.read_csv('data.csv')
df_excel = pd.read_excel('data.xlsx', sheet_name='Sheet1')
df_json = pd.read_json('data.json')
Reading datasets from external files allows analysts to load large datasets quickly, preserve column types and labels, and immediately begin exploration or preprocessing.
3) Writing DataFrames to External Sources
Writing DataFrames to external sources in Pandas involves exporting processed or cleaned data into formats like CSV, Excel, JSON, or SQL for storage and sharing. Pandas provides easy-to-use functions such as to_csv(), to_excel(), and to_json() that convert DataFrames into these file types efficiently. These functions allow customization of output, including handling of headers, index labels, and formatting. This feature helps save analysis results in a structured form for future use. Overall, writing DataFrames ensures smooth data exchange between different tools and workflows.
3.1 CSV: to_csv() exports DataFrames as CSV files. You can control whether the row index is included, specify separators, or encode data.
3.2 Excel: to_excel() writes DataFrames to Excel spreadsheets. Multiple DataFrames can be written to different sheets using ExcelWriter.
3.3 JSON: to_json() converts DataFrames to JSON for use in web applications or APIs. Parameters like orient and lines control the structure of the output.
Example:
df.to_csv('output.csv', index=False)
df.to_excel('output.xlsx', sheet_name='Sheet1', index=False)
df.to_json('output.json', orient='records', lines=True)
Exporting DataFrames ensures that cleaned or transformed datasets can be stored, shared, or reused in other tools, enabling seamless integration into data pipelines.
7. Data Selection and Indexing in Pandas
Data selection and indexing in Pandas refer to the methods used to access, filter, and retrieve specific rows, columns, or elements from a Series or DataFrame. Efficient data selection is crucial for exploring datasets, performing analysis, and preprocessing before machine learning or statistical operations. Pandas provides label-based, integer-based, and conditional indexing to select data flexibly and intuitively.
Selecting Columns
Columns can be selected using column names in brackets or as attributes. Columns returned are either a Series (single column) or a DataFrame (multiple columns).
Example:
import pandas as pd
data = {
'Name': ['Alice', 'Bob', 'Charlie'],
'Age': [25, 30, 35],
'City': ['New York', 'Los Angeles', 'Chicago']
}
df = pd.DataFrame(data)
# Select single column
age_series = df['Age']
# Select multiple columns
subset_df = df[['Name', 'City']]
print(age_series)
print(subset_df)
Selecting Rows
Selecting rows in Pandas refers to choosing specific records from a DataFrame using index labels, integer positions, or conditional filtering. This can be done using methods like loc for label-based selection and iloc for position-based selection. Row selection also includes applying conditions to extract only the rows that meet certain criteria. Overall, it helps focus on relevant data for analysis and simplifies data exploration.
3.1 Label-based selection with .loc: Select rows by their index labels.
row_0 = df.loc[0] # First row by label
rows_subset = df.loc[0:1] # First two rows
3.2 Integer-based selection with .iloc: Select rows by integer positions.
row_0 = df.iloc[0] # First row by position
rows_subset = df.iloc[0:2] # First two rows
Conditional Selection
Conditional selection in Pandas involves filtering DataFrame rows based on specific conditions or logical expressions. It allows you to extract only the data that meets criteria such as comparisons, ranges, or multiple conditions combined with logical operators. This technique uses boolean masks to return rows where the condition is true. Overall, conditional selection is essential for isolating meaningful subsets of data during analysis.
Example:
adults = df[df['Age'] >= 30] # Select rows where Age >= 30
print(adults)
This returns rows where the condition is True, making it useful for filtering datasets based on specific criteria.
Selecting Specific Elements
Selecting specific elements in Pandas refers to accessing individual cells or particular data points within a DataFrame using row and column references. This is done using loc for label-based selection and iloc for position-based selection, allowing precise targeting of values. It helps retrieve, modify, or analyze exact elements without affecting the rest of the data. Overall, it provides fine-grained control when working with detailed parts of a dataset.
Example:
value = df.at[1, 'City'] # Row 1, column 'City'
value_i = df.iat[1, 2] # Row 1, column at position 2
print(value, value_i)
8. Data Cleaning in Pandas
Data cleaning in Pandas involves preparing raw data by fixing issues like missing values, duplicates, and incorrect formats to make it suitable for analysis. It provides simple functions to fill, remove, or replace missing data, ensuring consistency across the dataset. Pandas also helps standardize column types, rename labels, and correct errors efficiently. Overall, data cleaning is essential for improving data quality and ensuring accurate analytical results.
Handling Missing Data
Handling missing data in Pandas involves identifying and managing gaps or null values in a DataFrame to ensure accurate analysis. Pandas provides functions like isna(), dropna(), and fillna() to detect, remove, or replace missing values efficiently. Strategies include filling with default values, forward/backward filling, or dropping incomplete rows or columns. Overall, proper handling of missing data improves data quality and reliability of analytical results.
2.1 Identifying Missing Data:
import numpy as np
data = {
'Name': ['Alice', 'Bob', 'Charlie', None],
'Age': [25, 30, None, 28],
'City': ['New York', 'Los Angeles', 'Chicago', 'Chicago']
}
df = pd.DataFrame(data)
# Check missing values
print(df.isnull())
print(df.isnull().sum()) # Count missing values per column
2.2 Removing Missing Data:
df_dropped = df.dropna() # Remove rows with any missing value
print(df_dropped)
2.3 Filling Missing Data:
df_filled = df.fillna({'Name': 'Unknown', 'Age': df['Age'].mean()})
print(df_filled)
Here, missing names are replaced with 'Unknown' and missing ages with the mean age, which is a common strategy in data preprocessing.
Handling Duplicates
Handling duplicates in Pandas involves identifying and managing repeated rows or entries in a DataFrame to maintain data integrity. Pandas provides functions like duplicated() to detect duplicates and drop_duplicates() to remove them efficiently. You can also choose to keep the first, last, or none of the duplicate entries based on analysis needs. Overall, handling duplicates ensures cleaner datasets and more accurate analysis results.
3.1 Identifying Duplicates:
df_duplicates = pd.DataFrame({
'Name': ['Alice', 'Bob', 'Alice', 'Charlie'],
'Age': [25, 30, 25, 35]
})
print(df_duplicates.duplicated()) # Returns True for duplicate rows
3.2 Removing Duplicates:
df_no_duplicates = df_duplicates.drop_duplicates()
print(df_no_duplicates)
Duplicates can also be removed based on specific columns by passing the subset parameter, which is helpful when only certain fields need to be unique.
