Python for Data Analysis
Python for Data Analysis is a powerful programming approach that leverages Python’s versatile libraries and tools to collect, clean, process, and visualize data efficiently. It enables analysts and data scientists to extract meaningful insights from complex datasets using intuitive and readable code. With libraries like Pandas, NumPy, and Matplotlib, Python simplifies data manipulation, statistical analysis, and graphical representation for informed decision-making.
1. Simplicity and Readability
Python is widely regarded as one of the easiest programming languages to learn and use due to its clear syntax and readability. This simplicity allows analysts and data scientists to focus on solving analytical problems rather than dealing with complex programming constructs. Python’s readability makes it suitable for beginners and experts alike, enabling efficient development, collaboration, and reproducibility in data analysis workflows.
2. Versatility and Integration
Python is a versatile language capable of handling structured and unstructured data, including numerical, textual, and visual datasets. It integrates seamlessly with databases, APIs, and big data frameworks like Spark and Dask. This versatility allows Python to serve as a unified platform for data collection, processing, analysis, visualization, and machine learning, making it suitable for a wide range of business, research, and technology applications.
3. Extensive Library Ecosystem
Python provides an extensive ecosystem of libraries specifically designed for data analysis tasks. Libraries such as Pandas enable data manipulation and cleaning, NumPy supports efficient numerical computations, Matplotlib and Seaborn allow data visualization, and Scikit-learn, TensorFlow, and PyTorch facilitate machine learning and predictive modeling. These libraries simplify complex analytical tasks, reduce development time, and provide reliable, well-tested tools for handling diverse datasets.
4. Support for Data Visualization
Python supports advanced data visualization, which is critical for communicating insights and discovering patterns. Libraries such as Matplotlib, Seaborn, and Plotly allow the creation of static and interactive charts, graphs, and dashboards. Visualization not only helps in understanding trends and relationships in data but also assists in validating hypotheses, detecting anomalies, and presenting findings effectively to stakeholders.
5. Machine Learning and Predictive Analytics
Python plays a crucial role in implementing machine learning and predictive analytics. By providing libraries like Scikit-learn, TensorFlow, and PyTorch, Python enables analysts to build, train, and evaluate models for classification, regression, clustering, and deep learning. This capability allows organizations to predict future trends, automate decision-making, and gain actionable insights from large datasets.
6. Reproducibility and Collaboration
Python supports reproducibility and collaborative analysis through tools such as Jupyter Notebooks, which combine code, output, and documentation in a single interface. This allows analysts to share workflows, document methods, and reproduce analyses efficiently. Such features are critical for team-based projects, research documentation, and business reporting, ensuring that data analysis is transparent and verifiable.
7. Automation and Scalability
Python enables automation of repetitive data tasks such as cleaning, processing, and reporting. With libraries like Pandas, NumPy, and Dask, Python can handle large-scale datasets and perform computations efficiently, making it suitable for both small projects and enterprise-level data pipelines. This scalability ensures that data analysis remains effective as datasets grow in size and complexity. Python’s simplicity, versatility, rich library ecosystem, and support for visualization, machine learning, reproducibility, and scalability make it an ideal language for modern data analysis, empowering organizations and researchers to extract actionable insights, make informed decisions, and implement data-driven strategies.
Importance of Python for Data Analysis
Python has become the preferred language for data analysis due to its combination of simplicity, versatility, and powerful libraries. Its importance lies in enabling analysts, data scientists, and researchers to handle data efficiently, gain insights, and implement data-driven solutions across industries. Python’s ecosystem supports end-to-end workflows, from data collection to visualization and machine learning, making it invaluable in both business and technology applications.
1. Efficient Data Handling and Manipulation
Python is crucial for efficiently handling large volumes of data. Libraries such as Pandas and NumPy allow analysts to clean, transform, and manipulate datasets with ease, reducing manual effort and minimizing errors. The ability to perform complex data operations efficiently ensures that organizations can process information faster and focus on deriving insights, which is especially important in data-intensive environments like finance, e-commerce, and scientific research.
2. Simplifying Complex Analytical Tasks
Python simplifies complex analytical tasks, allowing users to perform statistical analysis, predictive modeling, and machine learning without extensive programming knowledge. Libraries like Scikit-learn, TensorFlow, and PyTorch provide ready-to-use functions for advanced computations. This reduces development time and allows analysts to focus on interpreting results and making decisions, which improves productivity and accelerates project timelines.
3. Enhanced Data Visualization and Communication
Python’s visualization libraries, including Matplotlib, Seaborn, and Plotly, are essential for communicating insights effectively. Clear, interactive visualizations help stakeholders understand patterns, trends, and relationships in data, enabling informed decision-making. Visualization also aids in detecting anomalies and validating hypotheses, making Python an important tool for both analysis and reporting.
4. Support for Machine Learning and Predictive Analytics
Python’s role in machine learning and predictive analytics is vital for modern data-driven applications. By providing libraries and frameworks for classification, regression, clustering, and deep learning, Python enables organizations to anticipate trends, automate decisions, and optimize processes. This predictive capability enhances competitive advantage and supports strategic planning across industries such as healthcare, finance, marketing, and technology.
5. Flexibility and Integration Across Platforms
Python is highly flexible and can integrate seamlessly with databases, APIs, web applications, and big data platforms. This allows analysts to combine multiple data sources, automate workflows, and implement scalable solutions. Its versatility ensures that Python can be applied in a wide range of contexts, from small-scale research projects to enterprise-level data pipelines, making it an indispensable tool for data analysis.
6. Reproducibility and Collaboration
Python enables reproducibility and collaboration through tools like Jupyter Notebooks, which combine code, outputs, and documentation in a single environment. This is crucial for team projects, academic research, and business reporting, allowing analysts to share methods, reproduce results, and maintain transparency. Reproducible workflows improve reliability and accountability in data-driven decision-making.
7. Automation and Scalability of Data Processes
Python’s capabilities allow for automation of repetitive data tasks such as cleaning, transformation, and reporting. Coupled with libraries like Dask and Pandas, Python can scale to handle large datasets efficiently, making it suitable for high-volume business environments and big data applications. This scalability ensures that organizations can process more data in less time while maintaining accuracy, which is crucial for timely decision-making.
Python’s importance in data analysis lies in its ability to simplify data handling, perform advanced analytics, support visualization, integrate across platforms, enable predictive modeling, ensure reproducibility, and scale operations efficiently. Its ecosystem of libraries and tools empowers professionals to extract actionable insights, make informed decisions, and implement data-driven strategies effectively, making Python a cornerstone of modern data analysis practice.
Libraries for Data Analysis in Python
Python’s popularity in data analysis is largely due to its rich ecosystem of libraries that provide tools for data manipulation, visualization, statistical analysis, and machine learning. These libraries simplify complex tasks, reduce development time, and allow analysts to extract meaningful insights from raw data efficiently.
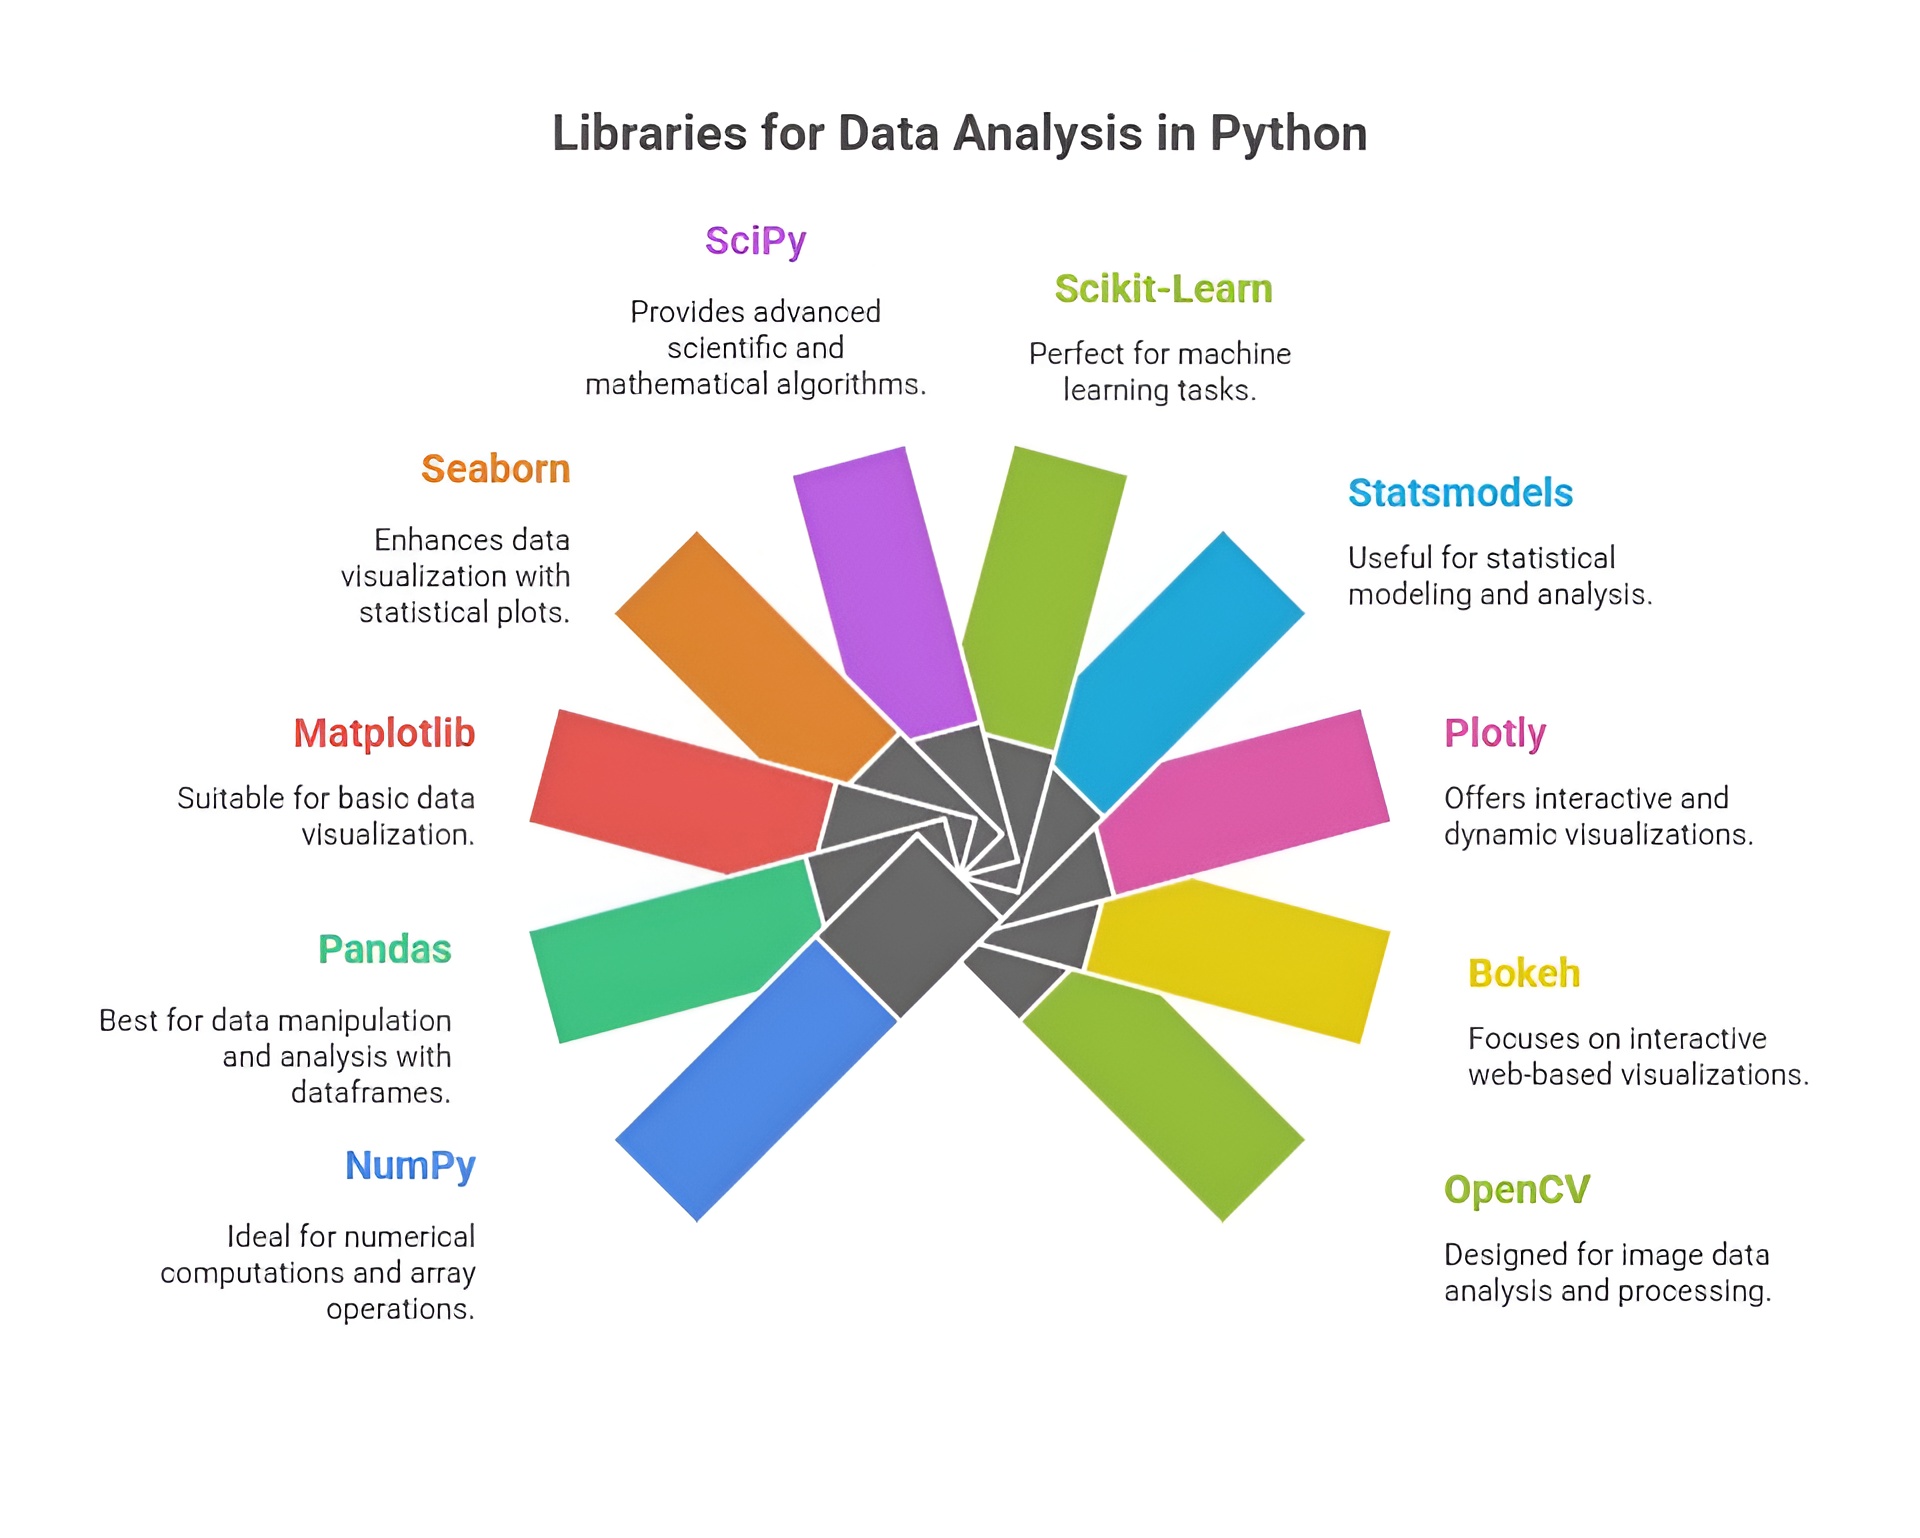
1. Pandas
Pandas is one of the most essential libraries for data analysis in Python. It provides high-performance data structures such as DataFrames and Series that allow users to store, manipulate, and analyze structured data with ease. Pandas supports operations like filtering, grouping, merging, reshaping, and cleaning datasets, making it ideal for preprocessing and organizing data for analysis. It also integrates well with other libraries such as NumPy, Matplotlib, and Scikit-learn, making it a central tool for end-to-end data workflows.
2. NumPy
NumPy is the foundational library for numerical computing in Python. It provides multidimensional arrays, matrices, and a collection of mathematical functions for performing high-speed computations. NumPy is critical for handling large datasets, performing linear algebra operations, statistical calculations, and generating random numbers. Many other Python libraries, including Pandas and SciPy, are built on top of NumPy, making it indispensable for scientific and analytical computing.
3. Matplotlib
Matplotlib is a versatile library for data visualization in Python. It allows users to create line plots, bar charts, scatter plots, histograms, and custom figures to communicate insights effectively. Matplotlib supports extensive customization, enabling analysts to adjust styles, colors, labels, and layouts. It is often used in combination with Pandas and NumPy to visualize processed data, making trends and patterns easier to interpret.
4. Seaborn
Seaborn is a statistical visualization library built on top of Matplotlib. It simplifies the process of creating informative and attractive visualizations by providing high-level functions for heatmaps, violin plots, box plots, pair plots, and regression plots. Seaborn automatically handles complex visualization tasks like color encoding, data aggregation, and distribution plotting, which makes it easier to identify relationships and patterns in datasets.
5. SciPy
SciPy extends NumPy by providing a wide range of scientific and technical computing functions, including linear algebra, optimization, signal processing, and statistical analysis. It is particularly useful for performing mathematical modeling, hypothesis testing, and advanced analytics. SciPy is widely used in engineering, physics, and research applications where robust computational methods are required.
6. Scikit-learn
Scikit-learn is a machine learning library for Python that provides tools for classification, regression, clustering, dimensionality reduction, and model evaluation. It integrates seamlessly with Pandas and NumPy, allowing analysts to build predictive models, perform feature selection, and evaluate algorithm performance efficiently. Scikit-learn is widely used in data analysis projects where predictive analytics or pattern recognition is required.
7. StatsModels
StatsModels is a Python library dedicated to statistical modeling and hypothesis testing. It provides functions for linear regression, generalized linear models, time series analysis, and statistical tests. StatsModels is useful for analysts who need to perform rigorous statistical analysis and interpret coefficients, p-values, and confidence intervals in research or business contexts.
8. Plotly
Plotly is a library for creating interactive and web-based visualizations. Unlike static plots from Matplotlib, Plotly allows users to zoom, pan, hover, and interact with graphs. It supports complex visualizations like 3D plots, interactive dashboards, and choropleth maps. Plotly is widely used in business intelligence, web applications, and data storytelling to create engaging, user-friendly visualizations.
9. Dask
Dask is a library for parallel computing and handling large datasets that do not fit into memory. It extends Pandas and NumPy functionality to distributed systems, enabling computation on big data efficiently. Dask is particularly useful for enterprise-scale projects where scalability, performance, and memory optimization are critical.
10. OpenPyXL / xlrd
OpenPyXL and xlrd are libraries used for reading and writing Excel files in Python. They are essential for handling spreadsheet data, performing operations like extracting data, cleaning, transforming, and exporting results. These libraries facilitate integration with traditional business tools, allowing analysts to process Excel-based data seamlessly.
11. TensorFlow / PyTorch
Although primarily deep learning frameworks, TensorFlow and PyTorch are also used in advanced data analysis when predictive modeling, neural networks, or large-scale numerical computation is required. They provide GPU acceleration and support high-dimensional data processing, automated differentiation, and machine learning pipelines, making them valuable for AI-driven data analytics projects.
Steps in Data Analysis
Data Analysis is a systematic process that transforms raw data into actionable insights, allowing organizations and researchers to make informed decisions. The process typically follows several essential steps, each playing a crucial role in ensuring that the final results are accurate, meaningful, and reliable. These steps encompass data collection, cleaning, exploration, visualization, and interpretation, forming a continuous cycle that refines understanding and supports decision-making.
1. Data Collection
Data collection is the first and most fundamental step in data analysis, involving the gathering of raw data from various sources. These sources can include databases, surveys, web scraping, IoT sensors, transactional records, social media, and APIs. The quality and reliability of collected data directly impact the accuracy of the analysis, making this step critical. In Python, libraries like Pandas, requests, BeautifulSoup, and APIs integration tools facilitate the collection of structured and unstructured data efficiently. The goal of this step is to acquire data that is relevant, sufficient, and representative of the problem being analyzed.
2. Data Cleaning
Data cleaning, also known as data preprocessing, is the process of detecting and correcting errors, inconsistencies, and missing values in the dataset. Raw data is often incomplete, duplicated, or noisy, which can lead to inaccurate analysis and misleading conclusions. Cleaning involves removing duplicates, handling null values, correcting formats, filtering outliers, and standardizing data types. Python provides extensive support for data cleaning through libraries such as Pandas, NumPy, and OpenRefine, allowing analysts to preprocess data efficiently and prepare it for accurate modeling and visualization. This step ensures that subsequent analysis is trustworthy and actionable.
3. Data Exploration
Data exploration is the step where analysts investigate the dataset to understand its structure, patterns, and key characteristics. This involves generating summary statistics, distributions, correlations, and identifying trends or anomalies. Exploratory Data Analysis (EDA) is a key component of this step, providing insights into relationships between variables and guiding feature selection or transformation for further modeling. Python libraries like Pandas for data manipulation, Matplotlib and Seaborn for visualization, and NumPy for numerical analysis make it possible to perform thorough exploration, revealing the most important insights from the dataset.
4. Data Visualization
Data visualization is the process of representing data graphically to communicate patterns, trends, and relationships effectively. Visualizations can take many forms, including line charts, bar charts, scatter plots, histograms, heatmaps, and interactive dashboards. Visualization is not only a tool for communication but also a method to detect anomalies, understand distributions, and validate assumptions in the data. Python provides powerful libraries such as Matplotlib, Seaborn, Plotly, and Bokeh for creating both static and interactive visualizations, enabling analysts to present data insights clearly to stakeholders or decision-makers.
5. Data Interpretation
Data interpretation is the final step where the insights gained from exploration and visualization are translated into actionable conclusions or recommendations. This involves understanding the implications of patterns, trends, and correlations, determining the significance of findings, and formulating decisions based on evidence. Interpretation ensures that the results of data analysis support real-world decision-making, strategy development, or problem-solving. In Python, interpretation often involves combining statistical analysis, predictive modeling, and visualization outputs to draw meaningful insights that guide business or research outcomes.
