Introduction to Data Analysis
Data Analysis is the process of inspecting, cleaning, transforming, and modeling data to extract useful information, identify patterns, and support decision-making. It is a fundamental step in converting raw data into meaningful insights that can guide strategies, optimize operations, and drive innovation. Data analysis involves collecting data from various sources, organizing it systematically, and applying statistical, computational, or visual methods to understand trends and relationships. Python, with its rich ecosystem of libraries, has become one of the most popular tools for performing data analysis due to its simplicity, flexibility, and extensive support for numerical and statistical operations.
1. What is Data Analysis?
Data Analysis refers to the systematic application of techniques to examine datasets and extract actionable insights. It includes tasks such as summarizing information, identifying correlations, detecting anomalies, and predicting future outcomes. Data analysis is not limited to numerical computation; it also involves visual representation and interpretation of results to communicate findings effectively. The process can be applied to structured data (like spreadsheets and databases) as well as unstructured data (like text, images, or sensor data). In Python, libraries such as NumPy, Pandas, Matplotlib, and Seaborn facilitate data handling, statistical analysis, and visualization, enabling users to explore datasets comprehensively.
Data analysis also encompasses data preprocessing, which involves cleaning missing values, handling outliers, normalizing or standardizing data, and converting data into formats suitable for modeling. This ensures accuracy and reliability of the insights derived from the analysis. Advanced data analysis includes applying machine learning and AI models to make predictions or identify hidden patterns that would not be immediately evident through basic descriptive statistics.
Importance of Data Analysis in Business and Technology
Data Analysis plays a critical role in modern business operations and technological development, allowing organizations and developers to make informed decisions, optimize processes, and innovate efficiently. It transforms raw data into meaningful insights, enabling strategic planning, problem-solving, and predictive modeling. The combination of advanced analytics techniques and computational tools like Python enhances the ability to extract valuable patterns and trends from large datasets.
1. Enhancing Decision-Making in Business
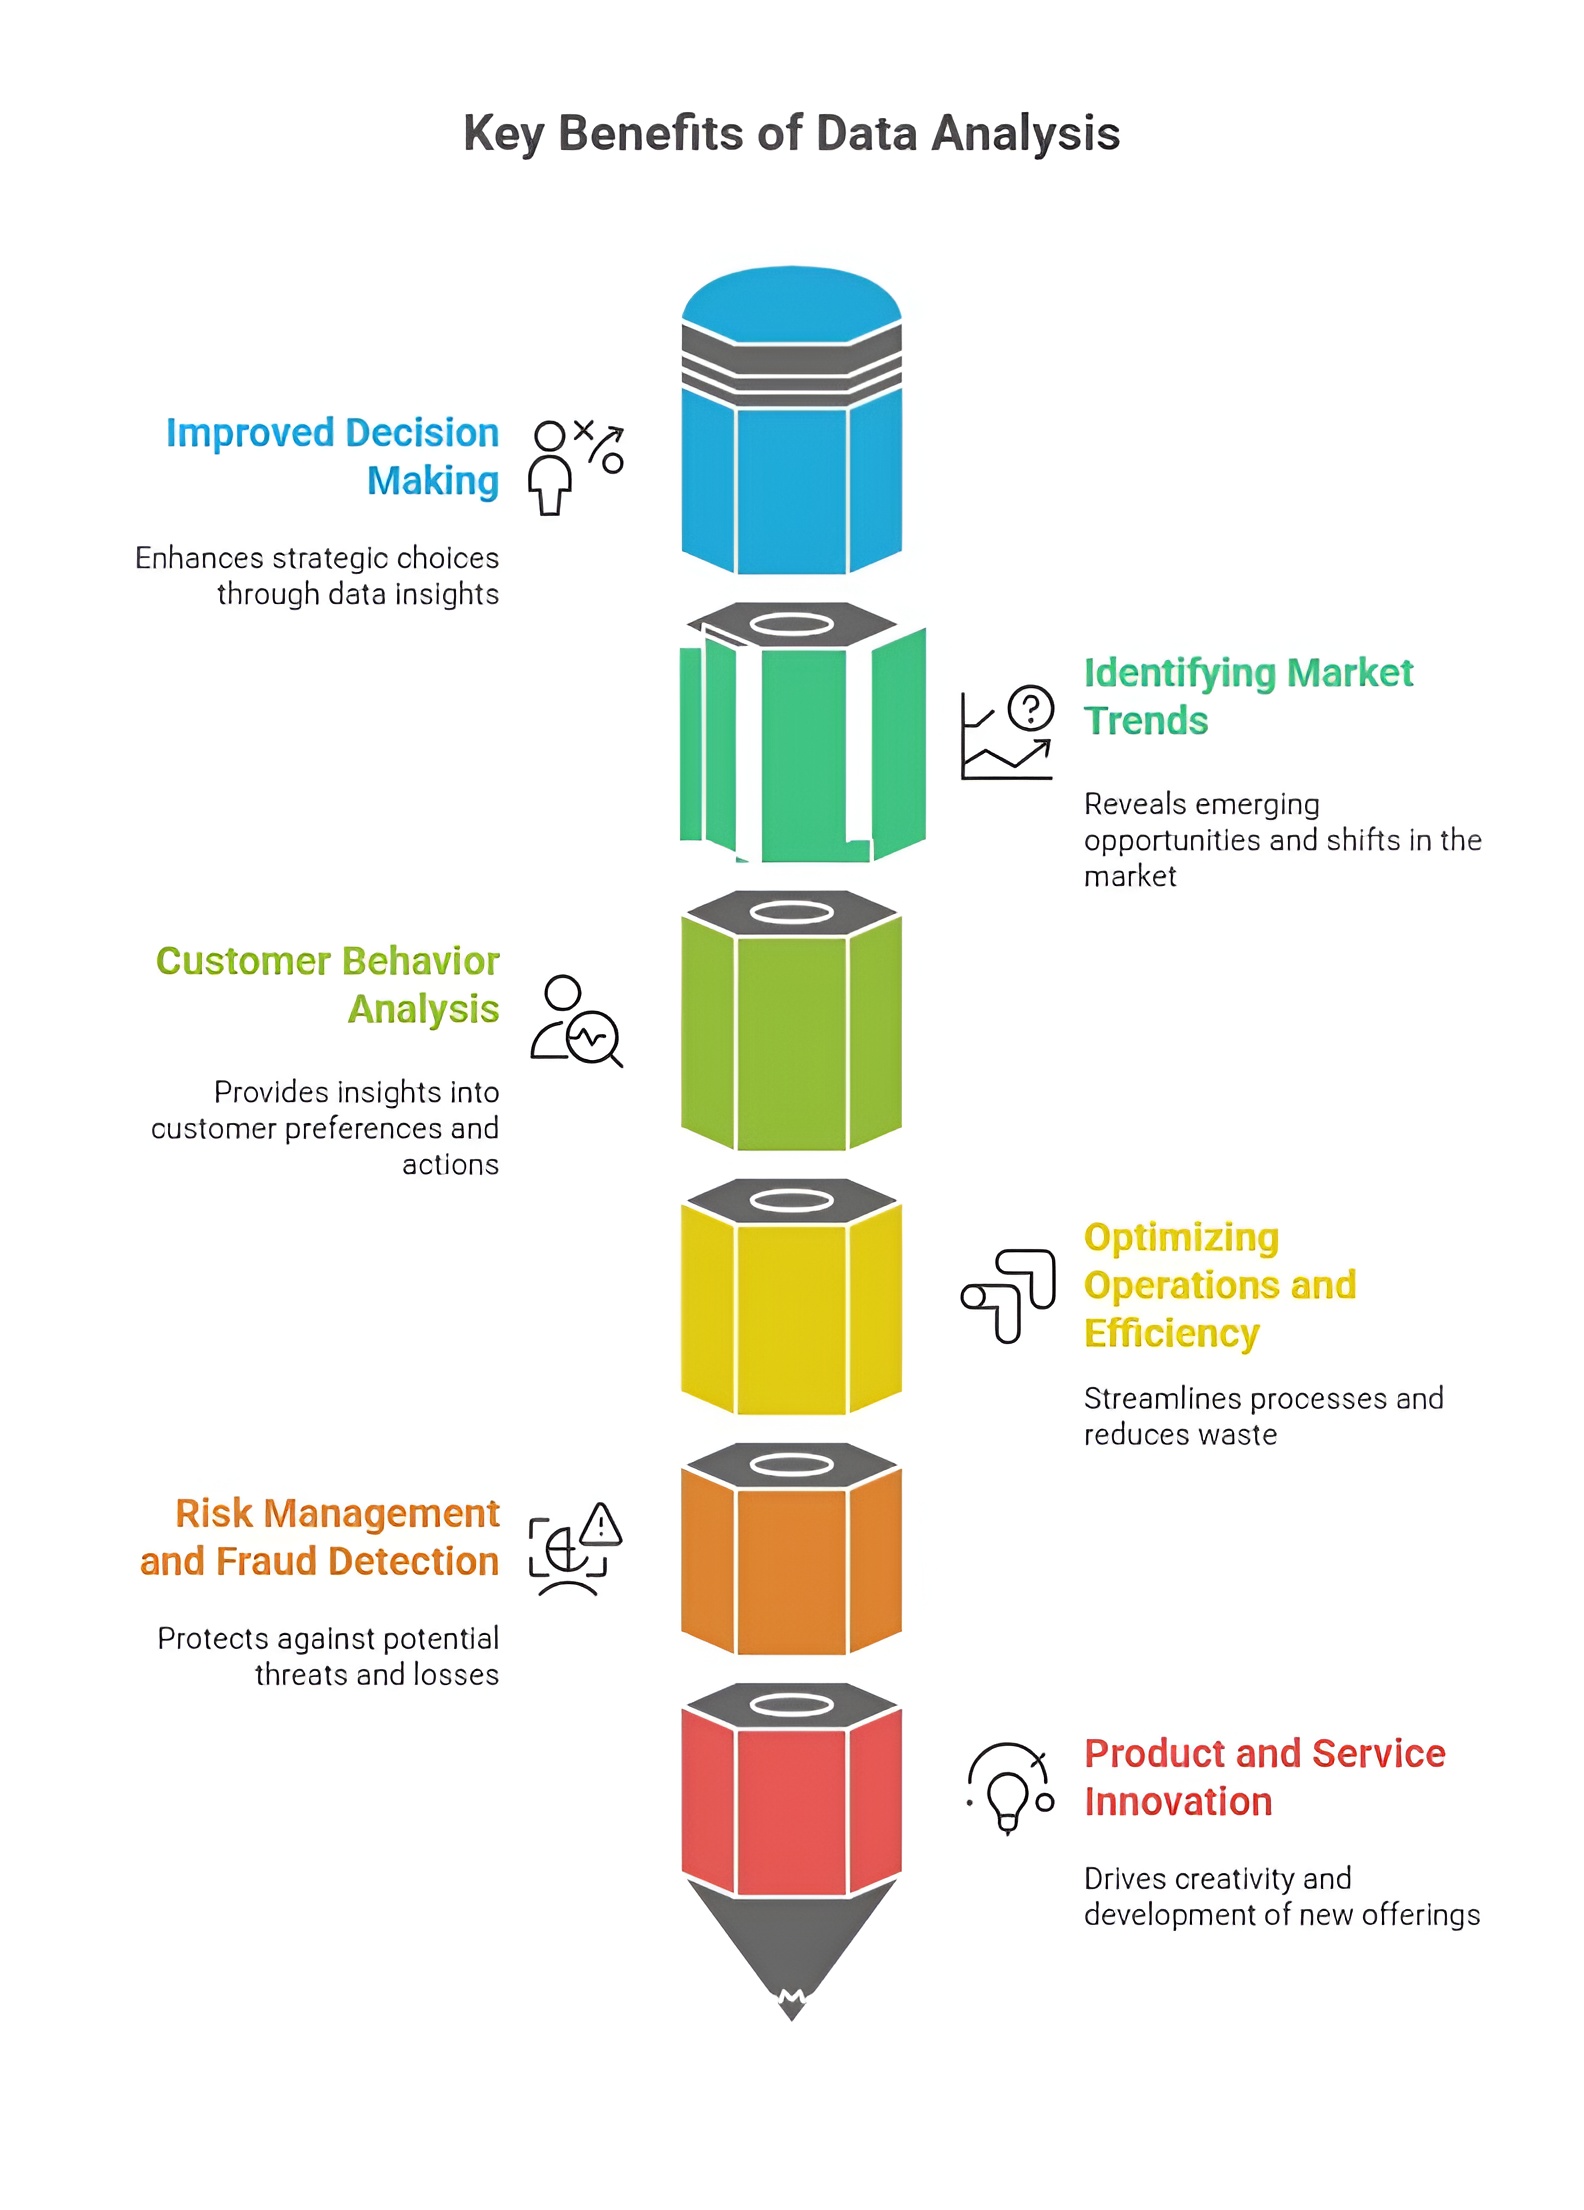
In business, data analysis enables organizations to make decisions based on facts and evidence rather than intuition or assumptions. By analyzing sales, customer behavior, market trends, and operational data, companies can identify opportunities, anticipate challenges, and allocate resources efficiently. Advanced analytics allows businesses to predict future trends, forecast demand, and optimize pricing strategies. This data-driven approach reduces risks, increases accuracy, and strengthens competitive advantage, ensuring that strategic decisions are grounded in verifiable insights rather than guesswork.
2. Improving Operational Efficiency
Data analysis helps businesses streamline operations and improve productivity by identifying inefficiencies, bottlenecks, and redundancies in workflows. Through the use of analytics tools, companies can monitor processes in real time, detect anomalies, and implement corrective measures proactively. In technology-driven businesses, data analysis also supports automation, predictive maintenance, and resource optimization, ensuring smooth and cost-effective operations. Python libraries such as Pandas and NumPy provide fast and flexible tools to process operational data and generate actionable reports.
3. Enhancing Customer Insights and Personalization
One of the most significant applications of data analysis in business is understanding customer preferences, behaviors, and trends. By examining transaction data, website interactions, and feedback, organizations can create personalized experiences, targeted marketing campaigns, and loyalty programs. Technology enables real-time analytics, allowing companies to adapt offers, services, and products to customer needs dynamically, thereby improving engagement, retention, and overall satisfaction. Data analysis in Python allows for pattern recognition, segmentation, and predictive modeling to anticipate future customer requirements.
4. Driving Innovation and Product Development
Data analysis fuels innovation by providing insights into market gaps, emerging trends, and user needs. Businesses can analyze large datasets to discover unmet demands and design products or services that align with customer expectations. In technology, data analysis supports algorithm development, AI training, and simulation-based testing, enabling the creation of smarter, more efficient systems. By leveraging Python’s machine learning and visualization libraries, organizations can experiment with prototypes, analyze performance, and optimize solutions before full-scale deployment.
5. Supporting Strategic Planning and Risk Management
Through comprehensive data analysis, businesses and tech organizations can assess potential risks, forecast outcomes, and plan strategies accordingly. Data-driven risk assessment allows companies to anticipate market fluctuations, regulatory challenges, or operational failures, and implement mitigation measures proactively. Technology and AI rely on large datasets to model scenarios, predict system failures, and optimize strategic decisions, ensuring resilience and sustainability. Python enables data manipulation, statistical modeling, and scenario analysis, making risk assessment and strategic planning more precise and reliable.
6. Advancing Technology and AI Applications
In the realm of technology, data analysis is indispensable for developing intelligent systems, machine learning models, and AI-driven solutions. It provides the necessary foundation for training algorithms, validating predictions, and evaluating system performance. Without accurate and structured data analysis, AI models cannot learn effectively or provide reliable outputs. Python’s ecosystem, including TensorFlow, PyTorch, and Scikit-learn, allows developers to preprocess data, engineer features, and build models that power autonomous systems, recommendation engines, and smart applications.
7. Enabling Competitive Advantage
In both business and technology sectors, organizations that effectively leverage data analysis gain a significant competitive edge. They can respond faster to market trends, optimize processes, reduce costs, and innovate continuously. Analytical insights allow companies to differentiate themselves from competitors, attract new customers, and retain existing ones. In technology, robust data analysis enables superior product performance, intelligent automation, and predictive capabilities, making organizations more agile and adaptive in rapidly evolving markets.
Data Analysis in business and technology is therefore essential for informed decision-making, operational efficiency, customer understanding, innovation, risk management, AI development, and competitive advantage. By converting raw data into actionable insights, organizations can navigate complex environments, optimize performance, and achieve sustainable growth. Python’s comprehensive libraries and tools make this process accessible, scalable, and effective, providing the computational power required to handle both large-scale and complex datasets efficiently.
Uses of Data Analysis in Business and Technology
Data Analysis has become a cornerstone for modern business strategy and technological advancement, enabling organizations and developers to extract actionable insights, optimize processes, and make informed decisions. By leveraging analytical techniques and Python libraries, data can be transformed into meaningful information that drives operational efficiency, innovation, and competitive advantage.
1. Business Performance Monitoring
Data analysis is extensively used to monitor and evaluate business performance across various functions such as sales, marketing, finance, and operations. By collecting and analyzing performance metrics, organizations can track progress, identify bottlenecks, and measure efficiency. Technology facilitates real-time monitoring through dashboards and automated reporting, allowing managers to respond promptly to changes. Python tools such as Pandas and Matplotlib enable seamless aggregation, visualization, and interpretation of performance data, supporting informed business management.
2. Customer Behavior Analysis
Understanding customer behavior is a primary application of data analysis in business. By analyzing purchase history, browsing patterns, social media interactions, and feedback, companies can identify trends, preferences, and pain points. This knowledge enables the creation of personalized marketing campaigns, product recommendations, and improved customer service. Advanced analytical techniques, combined with Python libraries like Scikit-learn and Seaborn, allow organizations to predict customer needs and optimize user experience, leading to increased satisfaction and loyalty.
3. Market Trend Prediction and Forecasting
Data analysis supports businesses and technology firms in predicting market trends and forecasting future outcomes. By examining historical data, sales patterns, and external factors, organizations can anticipate demand, optimize inventory, and make strategic investment decisions. In technology development, predictive analytics aids in anticipating user needs, system performance, and technological adoption trends. Python frameworks, including StatsModels and NumPy, provide robust tools for regression, time-series analysis, and predictive modeling to forecast accurately and minimize risks.
4. Operational Optimization
Data analysis is crucial for streamlining operations and improving efficiency. In business, it helps identify inefficiencies, reduce waste, and optimize resource allocation, while in technology, it enhances system performance and computational efficiency. Analytical methods allow organizations to analyze workflow, detect anomalies, and implement corrective measures, ensuring smooth operations. Python libraries such as SciPy and Pandas facilitate advanced computations, data transformation, and process optimization, making operational improvements more effective.
5. Risk Management and Compliance
Data analysis plays a vital role in identifying, assessing, and mitigating risks in both business and technology. By analyzing historical data, market trends, and operational metrics, organizations can detect potential threats, anticipate failures, and ensure compliance with regulations. Python’s analytical and statistical libraries, like NumPy, SciPy, and StatsModels, support risk modeling, scenario analysis, and predictive risk assessment, enabling proactive decision-making and reducing vulnerability.
6. Innovation and Product Development
In both business and technology, data analysis drives innovation by revealing unmet needs and emerging opportunities. Insights derived from data allow organizations to design new products, enhance existing services, and implement technological advancements. In technology, data analysis underpins AI model development, system optimization, and user experience improvements, ensuring that products and services are aligned with user expectations. Python’s libraries, including TensorFlow, PyTorch, and Scikit-learn, facilitate experimentation, modeling, and evaluation for innovative solutions.
7. Strategic Decision Support
Data analysis empowers organizations to make strategic decisions based on objective evidence rather than assumptions. Businesses can plan market entry, pricing strategies, expansion, and resource allocation using insights obtained from comprehensive datasets. In technology, it enables designing algorithms, optimizing workflows, and implementing intelligent systems. Python tools allow analysts and developers to process complex data efficiently, visualize patterns, and perform scenario analysis, ensuring decisions are informed and effective.
8. Enhancing Competitive Advantage
By leveraging data analysis, organizations gain a competitive edge in the marketplace. Analytical insights help companies understand market dynamics, outperform competitors, and respond to changing demands effectively. Technology-driven data analysis allows firms to deploy AI and machine learning solutions for smarter operations, predictive maintenance, and adaptive strategies, keeping them ahead of the competition. Python’s capabilities for data manipulation, visualization, and predictive modeling make it easier to implement these competitive strategies efficiently.
Data analysis in business and technology is therefore essential for performance monitoring, customer insights, trend prediction, operational optimization, risk management, innovation, strategic planning, and competitive advantage. Python provides a versatile and powerful ecosystem for implementing these analytical tasks, enabling organizations to extract actionable insights, make data-driven decisions, and achieve sustainable growth across industries.
Why Data Analysis is Useful
Data Analysis is an essential practice in business, research, and technology, providing the ability to transform raw data into actionable insights, support decision-making, and drive strategic initiatives. The usefulness of data analysis arises from its ability to simplify complexity, uncover hidden patterns, predict outcomes, and optimize processes, enabling organizations and individuals to operate more efficiently and effectively. Python, with its comprehensive libraries, enhances the usability and accessibility of data analysis for a wide range of applications.
1. Facilitates Informed Decision-Making
Data analysis is useful because it allows individuals and organizations to make decisions based on facts and evidence rather than intuition or assumptions. By systematically examining historical and real-time data, businesses can identify trends, evaluate performance, and anticipate future developments, leading to more accurate and confident decision-making. In technology, data analysis supports the design and evaluation of algorithms and intelligent systems, ensuring that computational models behave as expected and deliver reliable outcomes.
2. Identifies Patterns and Trends
Data analysis is invaluable for its ability to reveal patterns, correlations, and trends that are not immediately obvious. Recognizing these insights enables organizations to adapt strategies, optimize processes, and innovate effectively. For example, analyzing customer purchase behavior can uncover seasonal trends, while analyzing sensor data in robotics can identify recurring operational issues. Python libraries like Pandas, NumPy, and Matplotlib provide tools to process, analyze, and visualize these patterns efficiently, making them easier to interpret and act upon.
3. Enhances Efficiency and Reduces Costs
By analyzing operational, financial, or technological data, data analysis helps organizations streamline workflows, optimize resource utilization, and reduce unnecessary costs. Identifying inefficiencies, detecting anomalies, and predicting maintenance requirements prevent downtime and improve productivity. In technology-driven sectors, data analysis allows for performance monitoring, automation, and optimization of algorithms, which reduces computational cost and improves system reliability.
4. Supports Innovation and Strategic Planning
Data analysis is useful for driving innovation and informed strategic planning. By examining large datasets, businesses can identify market gaps, emerging customer needs, and opportunities for new products or services. In technology, analyzing usage data, performance metrics, and experimental results guides the development of intelligent systems, AI models, and software applications. Python facilitates these activities by providing tools for predictive modeling, simulation, and visualization, allowing organizations to innovate efficiently and strategically.
5. Predicts Future Outcomes
One of the key uses of data analysis is its ability to forecast trends, behavior, and results based on historical data. Predictive analytics enables organizations to anticipate demand, optimize inventory, plan marketing campaigns, and manage risks proactively. In technology, predictive modeling informs system performance, user behavior, and machine learning predictions, ensuring that solutions remain accurate and adaptive. Python libraries like Scikit-learn, StatsModels, and TensorFlow make predictive analytics accessible and powerful for real-world applications.
6. Improves Customer Understanding
Data analysis is useful because it allows organizations to gain a deep understanding of customer preferences, needs, and behavior. By analyzing interaction data, feedback, and purchase history, businesses can personalize services, improve user experience, and increase customer satisfaction and loyalty. In technology and AI, user data analysis helps optimize interfaces, recommendations, and system responses, ensuring intelligent solutions meet user expectations.
7. Enhances Competitiveness
Data analysis gives organizations a competitive advantage by enabling data-driven strategies. Companies that leverage analytics can respond faster to market changes, outperform competitors, and make evidence-based decisions. In technology, analyzing system performance, AI outputs, and algorithm efficiency allows for continuous improvement, better deployment strategies, and smarter innovations, keeping organizations ahead in rapidly evolving markets. Data Analysis is useful because it empowers informed decision-making, uncovers patterns, improves efficiency, drives innovation, predicts future outcomes, enhances customer understanding, and strengthens competitiveness. Its usefulness spans across business, research, and technology, and Python’s ecosystem of libraries ensures that data analysis can be conducted efficiently, accurately, and at scale, making it a fundamental tool for modern problem-solving and strategic planning.
Fields of Data Analysis
Data Analysis is a multidisciplinary field that spans various domains, each focusing on different types of data, techniques, and applications. These fields allow analysts, researchers, and organizations to understand data, extract insights, and make informed decisions. Python and its libraries provide tools to implement methods and solutions across all these fields, making it a versatile language for data-driven tasks.
1. Descriptive Analysis
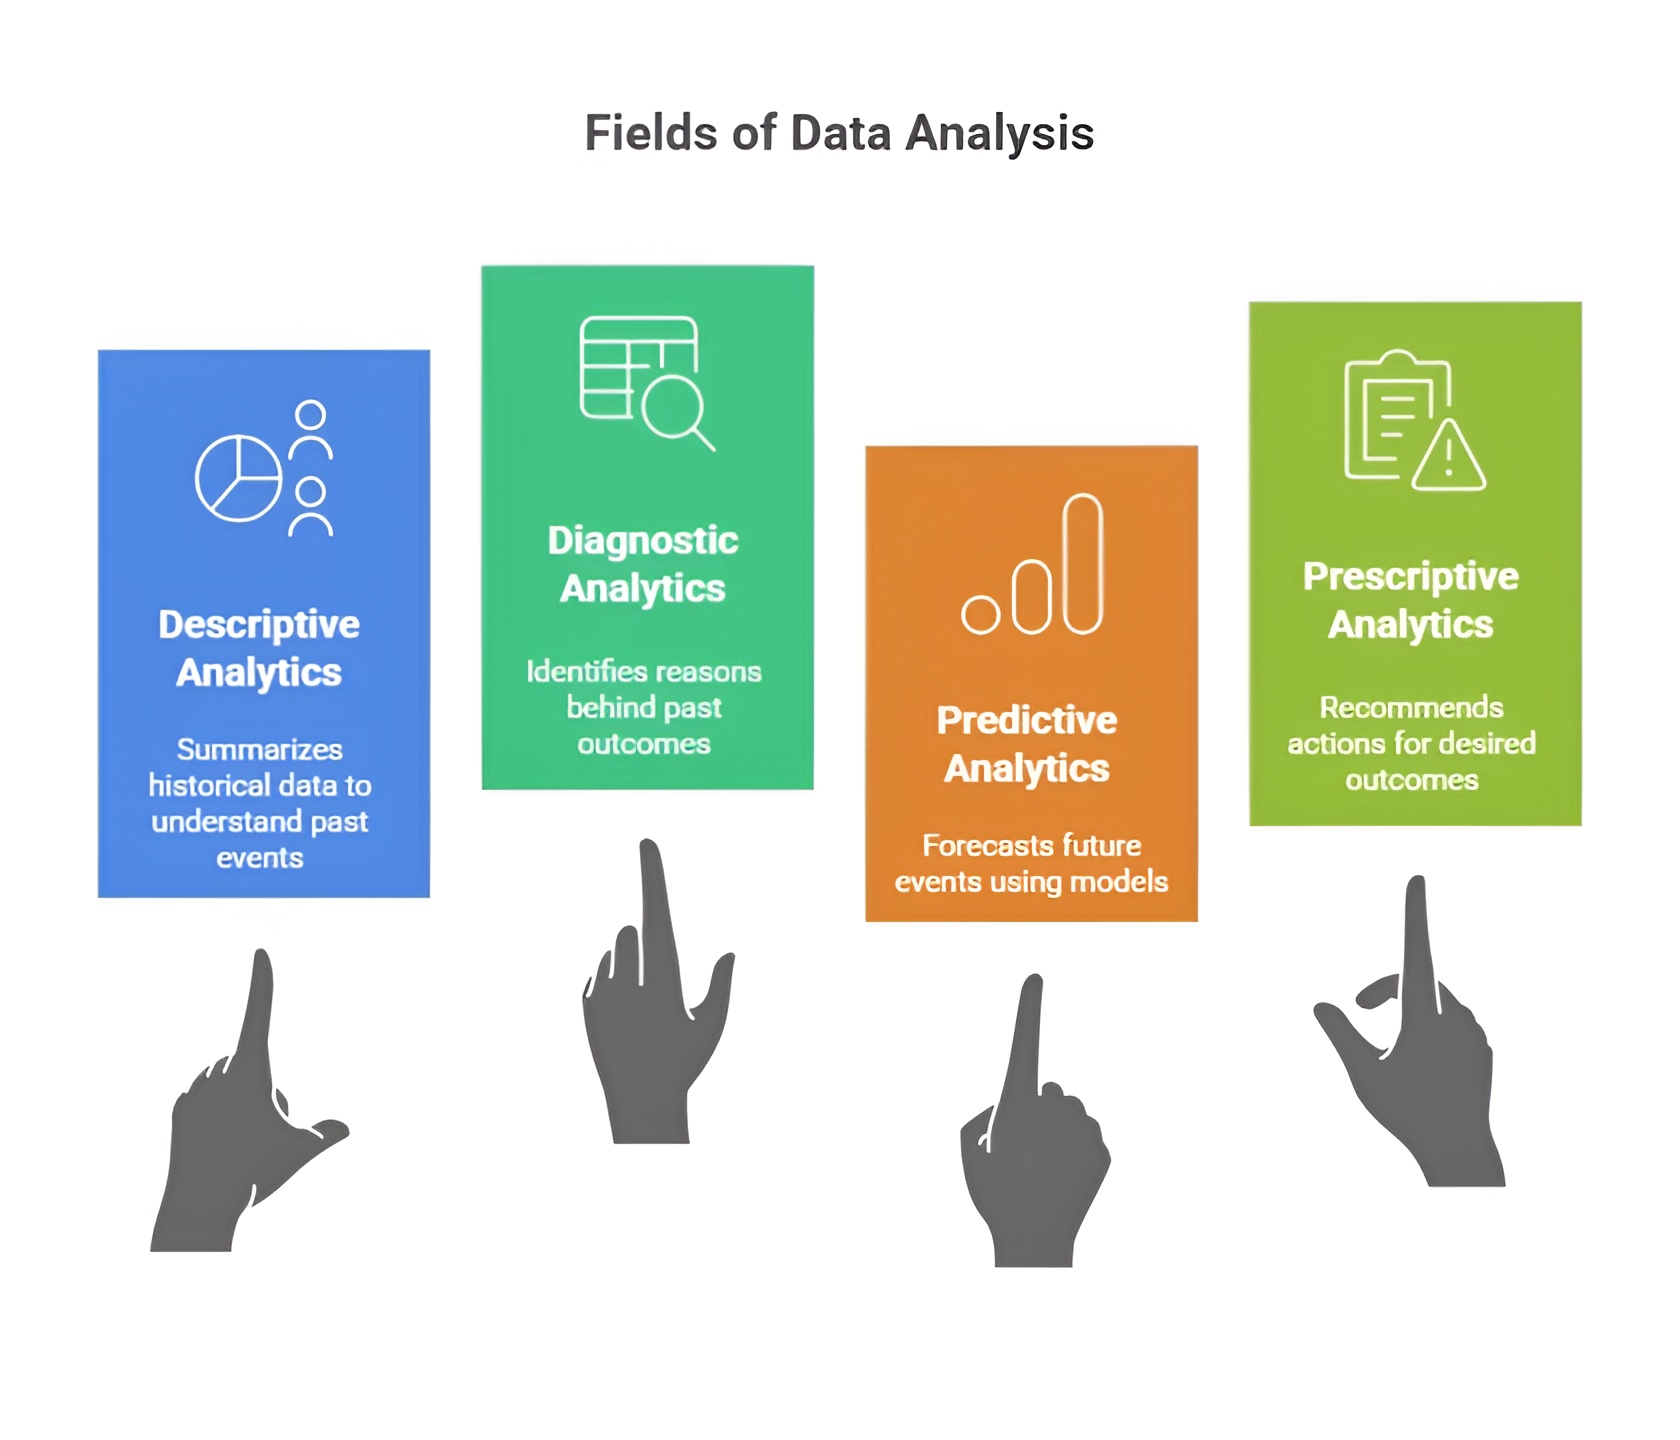
Descriptive Analysis is the field of data analysis that focuses on summarizing and interpreting historical data to understand what has happened. It involves collecting, organizing, and visualizing data to identify trends, patterns, and anomalies. Descriptive analysis provides insights into past performance and behavior without making predictions about the future. For example, businesses use it to analyze sales performance, website traffic, or customer demographics. Python libraries such as Pandas, NumPy, and Matplotlib are widely used for data cleaning, aggregation, and visualization in descriptive analytics.
2. Diagnostic Analysis
Diagnostic Analysis seeks to determine why certain events or patterns occurred by examining relationships, correlations, and root causes in the data. It goes beyond description by analyzing cause-and-effect relationships and uncovering the factors influencing outcomes. For instance, if a company notices a sudden drop in sales, diagnostic analysis can help identify whether it is due to market trends, pricing strategies, or operational issues. Python tools like SciPy, StatsModels, and Seaborn allow analysts to perform correlation tests, hypothesis testing, and statistical modeling for accurate diagnostics.
3. Predictive Analysis
Predictive Analysis involves using historical and current data to forecast future outcomes or trends. It employs statistical models, machine learning algorithms, and pattern recognition techniques to predict customer behavior, market trends, or system performance. For example, retailers use predictive analysis to anticipate product demand, while technology companies use it to forecast server load or user engagement. Python libraries such as Scikit-learn, TensorFlow, and StatsModels provide robust tools for regression, classification, and predictive modeling to generate accurate forecasts.
4. Prescriptive Analysis
Prescriptive Analysis is the field of data analysis that suggests actionable strategies or decisions based on insights derived from data. It combines predictive modeling with optimization techniques to recommend the best course of action. For instance, a logistics company can use prescriptive analysis to optimize delivery routes, or a financial institution can use it to recommend investment strategies. Python libraries like PuLP, Pyomo, and SciPy are widely used to implement optimization algorithms and prescriptive models.
5. Exploratory Data Analysis (EDA)
Exploratory Data Analysis is the process of investigating datasets to discover patterns, anomalies, and relationships without prior assumptions. EDA allows analysts to understand data distribution, identify outliers, and prepare data for modeling. Visualizations, summary statistics, and interactive plots are essential in this field to uncover insights that inform further analysis. Python provides comprehensive tools for EDA, including Pandas for data manipulation, Matplotlib and Seaborn for visualization, and Plotly for interactive exploration.
6. Inferential Analysis
Inferential Analysis involves using sample data to make generalizations or predictions about a larger population. This field applies statistical techniques such as hypothesis testing, confidence intervals, and regression to draw conclusions beyond the observed dataset. For example, a company might survey a subset of customers to infer satisfaction levels across its entire customer base. Python libraries like StatsModels, SciPy, and NumPy facilitate statistical analysis and inference for accurate and meaningful conclusions.
7. Real-Time and Streaming Analysis
Real-Time and Streaming Analysis focuses on processing and analyzing data as it is generated, enabling immediate insights and actions. This field is crucial for applications such as fraud detection, financial trading, sensor monitoring, and live customer analytics. Python tools such as Apache Kafka, PySpark Streaming, and Dask allow analysts and developers to handle large volumes of streaming data, perform computations in real-time, and respond quickly to emerging patterns or anomalies.
8. Text and Sentiment Analysis
Text and Sentiment Analysis is the field that deals with analyzing unstructured textual data to extract meaning, opinions, and insights. It is widely used in social media monitoring, customer feedback analysis, and opinion mining. Techniques such as natural language processing (NLP), tokenization, sentiment scoring, and topic modeling enable organizations to interpret text data effectively. Python libraries like NLTK, SpaCy, and TextBlob provide comprehensive tools for implementing text and sentiment analysis workflows.
9. Visual and Image Data Analysis
Visual and Image Data Analysis involves extracting insights from images, videos, or other visual data. It is commonly applied in medical imaging, facial recognition, industrial quality inspection, and autonomous vehicles. Techniques include object detection, image classification, segmentation, and feature extraction. Python libraries such as OpenCV, PIL, and Scikit-image provide extensive support for processing and analyzing visual data efficiently.
Data Analysis spans multiple fields, each with a unique focus—from describing past data and diagnosing causes to predicting future trends, optimizing decisions, and analyzing unstructured text or visual data. Python, with its rich ecosystem of libraries, supports all these fields by providing tools for data manipulation, visualization, statistical modeling, machine learning, and real-time processing, making it an essential language for modern data-driven applications.
