Data wrangling is the step that transforms raw, messy, and unstructured data into formats optimized for analysis, modeling, reporting, or visualization.
While data cleaning focuses on correcting errors, data wrangling focuses on reshaping, restructuring, and enriching the dataset so it becomes analytically powerful.
Data wrangling is a creative, iterative process—part engineering, part analysis, and part domain reasoning.
When performed effectively, it elevates dataset usability and directly improves model performance.
Reshaping Data
Reshaping data involves reorganizing the structure of a dataset to make it more suitable for analytical objectives.
Raw data is rarely structured exactly the way a data scientist needs it. You may receive it as a wide spreadsheet, nested JSON, log files, or a narrow long-format table.
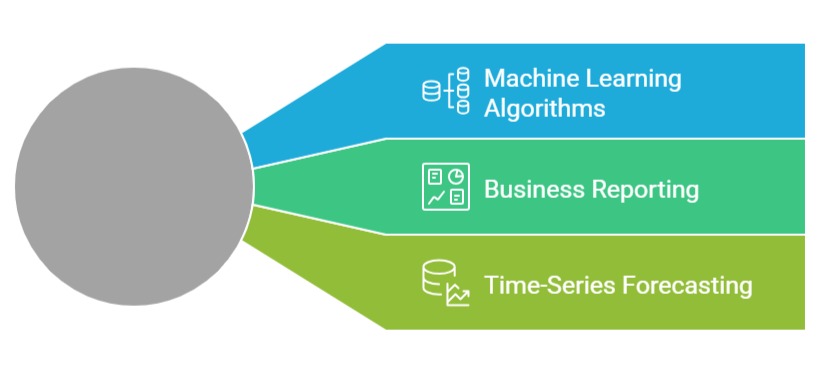
Reshaping techniques convert these structures into analytical formats compatible with statistical models, BI dashboards, and machine learning algorithms.
Long vs Wide Format Conversion
Data can exist in two essential structural formats:
Wide Format:
1. Each subject appears once
2. Multiple attributes appear as separate columns
Example: Monthly sales columns like Jan, Feb, Mar
Long Format:
1. Each row represents one observation of a variable
2. Suitable for time-series and machine learning
Example: Month and Sales columns instead of 12 monthly columns
Why Long/Wide Conversion Matters:
This transformation ensures compatibility with the intended analysis.
Tools like pd.melt() and pivot() in Python make conversions seamless.
Pivoting and Unpivoting Data
Pivoting transforms long data into wide format to create summaries or reorganize categories.
Use Cases of Pivoting:
1. Creating user-level summaries (e.g., total purchases by category)
2. Generating cross-tab reports for BI dashboards
3. Reshaping transactional data into analytical matrices
4. Unpivoting (also called melting) is the reverse process where wide data is condensed into long format.
Why It Matters: Unpivoting standardizes datasets with many repeated columns and makes them more compatible with statistical algorithms.
For example, converting columns like “Test1, Test2, Test3” into a single “Test Score” column improves modeling consistency.
Grouping and Aggregating
Aggregation helps summarize and condense large datasets.
Common Aggregations:
1. Sum of sales
2. Average temperature readings
3. Maximum and minimum values per group
4. Count of unique users or sessions
Why Aggregation is Critical:
1. Simplifies large datasets
2. Supports feature engineering (e.g., customer lifetime value)
3. Helps identify trends and patterns
4. Enables efficient model-ready datasets
Grouping and aggregation directly influence the quality of descriptive analytics and predictive features.
Feature Creation (Feature Engineering)
Feature engineering is the process of creating meaningful new variables that enhance the modeling power of algorithms.
Raw data often lacks the expressiveness required by machine learning models. By deriving new features, data scientists expose hidden patterns and relationships.
1. Deriving New Columns from Existing Variables
This involves creating new metrics or indicators based on combinations or transformations of existing columns.
Examples:
1. Age from birthdate
2. Time difference between events
3. Revenue growth rate
4. Customer activity scores
Why It Matters: Machine learning models identify patterns based on the features provided.
Well-designed features capture essential business logic and improve predictions significantly.
Encoding Categorical Variables (OHE, Label Encoding)
Most machine learning algorithms require numerical inputs. Categorical variables need encoding.
One-Hot Encoding:
1. Creates binary columns for each category.
2. Useful for nominal (unordered) categories like color or city.
Label Encoding:
1. Assigns numeric labels to categories.
2. Useful for ordinal categories like education level.
Why Encoding is Important: Incorrect encoding distorts patterns and biases models.
Proper encoding ensures compatibility with ML algorithms and preserves categorical meaning.
Binning and Scaling Data
Binning (Discretization):
1. Splits continuous variables into ranges.
2. Examples include income brackets or age groups.
Scaling:
1. Standardization (Z-score scaling)
2. Normalization (Min–Max scaling)
Impact on Modeling:
1. Many algorithms—such as kNN, SVM, and neural networks—are sensitive to scale.
2. Scaling ensures that all features contribute equally and models converge faster.
Merging and Joining Datasets
Modern data ecosystems rely on multiple structured and unstructured sources—databases, APIs, log files, CRM systems, ERP platforms, and more.
Combining these datasets is essential to build a unified and complete analytical view.
A. Combining Multiple Data Sources Using Keys
Joining involves merging datasets on common identifiers like:
1. Customer ID
2. Order ID
3. Product SKU
4. Email or phone number
5. Timestamp
Why Joins Are Critical:
1. Real-world data is distributed across systems.
2. CRM contains customer profiles
3. Transaction system contains purchase data
4. Web logs contain browsing behavior
Joining enriches datasets by creating a single unified dataset that models real-world entities accurately.
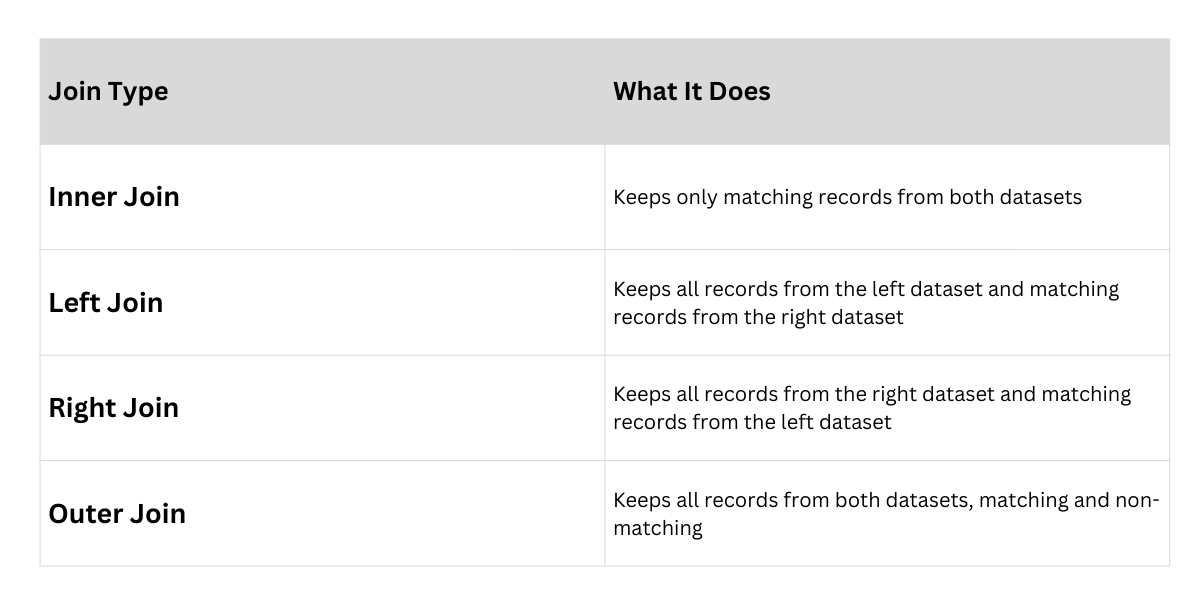
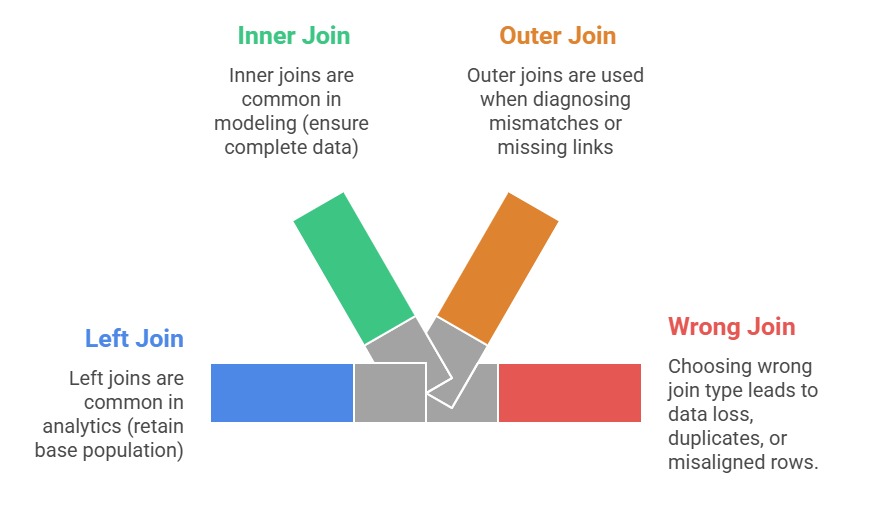
B. Handling Join Types (Inner, Left, Right, Outer)
Different join types control how datasets combine.
Common Join Types