USD ($)
$
United States Dollar
Euro Member Countries
India Rupee
د.إ
United Arab Emirates dirham
ر.س
Saudi Arabia Riyal

Summary Statistics: Mean, Median, Mode, Standard Deviation, Variance, Range

Lesson 13/51 | Study Time: 15 Min

Summary statistics are essential tools in descriptive statistics that provide a compact and informative snapshot of a dataset.

By condensing complex and large amounts of data into simple numerical values, they help analysts, researchers, and decision-makers quickly understand key characteristics such as central tendency, variability, and data distribution.

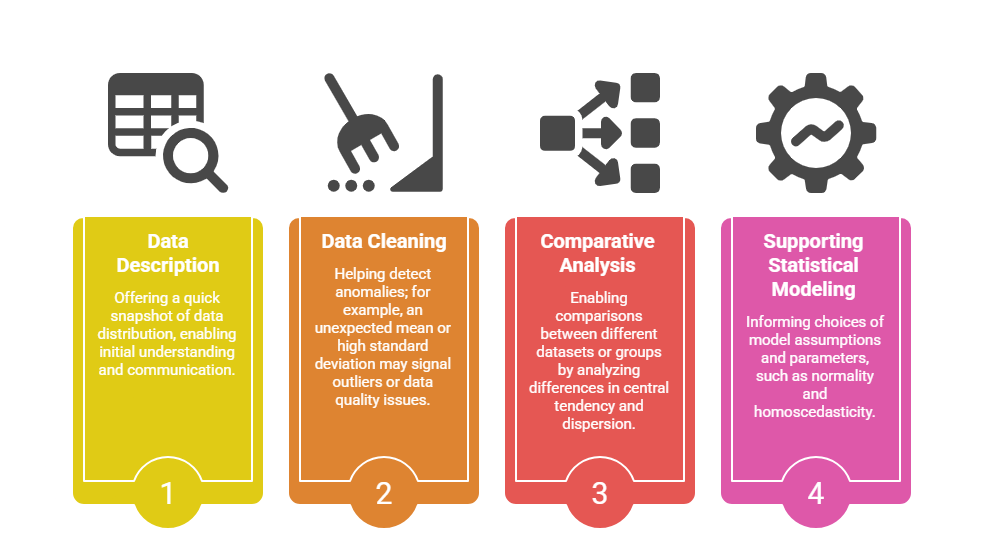
Employing summary statistics is often the first step in any robust data analysis workflow, providing foundational insights that guide further exploration, validation, and modeling. 

Measures of Central Tendency: Mean, Median, and Mode

These statistics indicate the central or typical value around which data points tend to cluster.


Mean: Commonly referred to as the average, it is calculated by summing all values and dividing by the total number of observations. The mean is sensitive to outliers, which can skew its value.

Median: The middle value when data is ordered from smallest to largest. It is robust to outliers and skewed data, providing a better measure of central tendency for non-normal distributions.

Mode: The value that occurs most frequently in the dataset. Unlike mean and median, the mode is useful for categorical data and can have multiple modes if several values occur with equal highest frequency.

Measures of Dispersion: Standard Deviation, Variance, and Range

These metrics describe the spread or variability within the data, indicating how spread out or clustered the data points are.


Range: The difference between the maximum and minimum values. It provides a simple measure of spread but is highly affected by extreme values.

Variance: The average of the squared differences between each data point and the mean. It quantifies overall data variability but is expressed in squared units, which might be less intuitive.

Standard Deviation: The square root of variance, expressed in the same units as the data, making it more interpretable. It shows the average distance of data points from the mean and is widely used in statistical analysis and risk assessment.

Application and Interpretation

Summary statistics play multiple roles in data analysis, including:

Evan Brooks

Evan Brooks

Product Designer
Profile

Class Sessions

1- Understanding Data Analytics and Its Business Value 2- Evolution and Career Scope in Data Analytics 3- Types of Analytics: Descriptive, Diagnostic, Predictive, and Prescriptive 4- Data-Driven Decision-Making Frameworks 5- Business Analytics Integration and Strategic Alignment 6- Data Sources: Internal, External, Structured, and Unstructured 7- Data Collection Methods and Techniques 8- Identifying Data Quality Issues and Assessment Frameworks 9- Data Cleaning Fundamentals: Removing Duplicates, Handling Missing Values, Standardizing Formats 10- Correcting Inconsistencies and Managing Outliers 11- Data Validation and Quality Monitoring 12- Purpose and Importance of Exploratory Data Analysis 13- Summary Statistics: Mean, Median, Mode, Standard Deviation, Variance, Range 14- Measures of Distribution: Frequency Distribution, Percentiles, Quartiles, Skewness, Kurtosis 15- Correlation and Covariance Analysis 16- Data Visualization Techniques: Histograms, Box Plots, Scatter Plots, Heatmaps 17- Iterative Exploration and Hypothesis Testing 18- Regression Analysis and Trend Identification 19- Cluster Analysis and Segmentation 20- Factor Analysis and Dimension Reduction 21- Time-Series Analysis and Forecasting Fundamentals 22- Pattern Recognition and Anomaly Detection 23- Relationship Mapping Between Variables 24- Principles of Effective Data Visualization 25- Visualization Types and Their Applications 26- Creating Interactive and Dynamic Visualizations 27- Data Storytelling: Crafting Compelling Narratives 28- Narrative Structure: Problem, Analysis, Recommendation, Action 29- Visualization Best Practices: Color Theory, Labeling, and Clarity 30- Motion and Transitions for Enhanced Engagement 31- The Analytics Development Lifecycle (ADLC): Plan, Develop, Test, Deploy, Operate, Observe, Discover, Analyze 32- Planning Phase: Requirement Gathering and Stakeholder Alignment 33- Implementing Analytics Solutions: Tools, Platforms, and Technologies 34- Data Pipelines and Automated Workflows 35- Continuous Monitoring and Performance Evaluation 36- Feedback Mechanisms and Iterative Improvement 37- Stakeholder Identification and Audience Analysis 38- Tailoring Messages for Different Data Literacy Levels 39- Written Reports, Dashboards, and Interactive Visualizations 40- Presenting Insights to Executives, Technical Teams, and Operational Staff 41- Using Data to Support Business Decisions and Recommendations 42- Building Credibility and Trust Through Transparent Communication 43- Creating Actionable Insights and Clear Calls to Action 44- Core Principles of Data Ethics: Consent, Transparency, Fairness, Accountability, Privacy 45- The 5 C's of Data Ethics: Consent, Clarity, Consistency, Control, Consequence 46- Data Protection Regulations: GDPR, CCPA, and Compliance Requirements 47- Privacy and Security Best Practices 48- Bias Detection and Mitigation 49- Data Governance Frameworks and Metadata Management 50- Ethical Considerations in AI and Machine Learning Applications 51- Building a Culture of Responsible Data Use